Immigrants from Liberia 4 or more Vehicles in Household
COMPARE
Immigrants from Liberia
Select to Compare
4 or more Vehicles in Household
Immigrants from Liberia 4 or more Vehicles in Household
5.4%
4+ VEHICLES AVAILABLE
0.2/ 100
METRIC RATING
285th/ 347
METRIC RANK
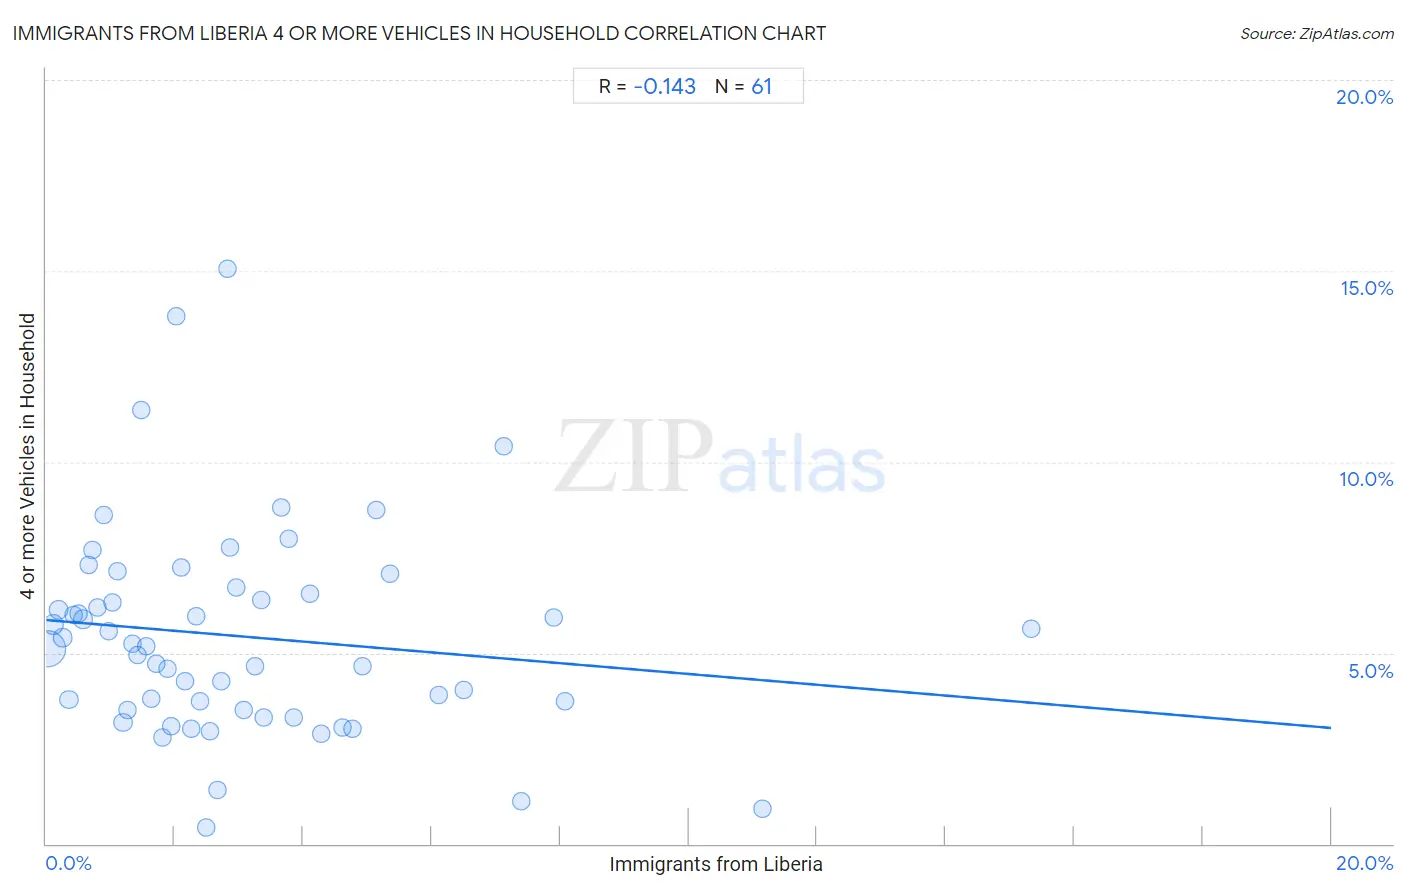
Immigrants from Liberia 4 or more Vehicles in Household Correlation Chart
The statistical analysis conducted on geographies consisting of 135,033,843 people shows a poor negative correlation between the proportion of Immigrants from Liberia and percentage of households with 4 or more vehicles available in the United States with a correlation coefficient (R) of -0.143 and weighted average of 5.4%. On average, for every 1% (one percent) increase in Immigrants from Liberia within a typical geography, there is a decrease of 0.14% in percentage of households with 4 or more vehicles available.
It is essential to understand that the correlation between the percentage of Immigrants from Liberia and percentage of households with 4 or more vehicles available does not imply a direct cause-and-effect relationship. It remains uncertain whether the presence of Immigrants from Liberia influences an upward or downward trend in the level of percentage of households with 4 or more vehicles available within an area, or if Immigrants from Liberia simply ended up residing in those areas with higher or lower levels of percentage of households with 4 or more vehicles available due to other factors.
Demographics Similar to Immigrants from Liberia by 4 or more Vehicles in Household
In terms of 4 or more vehicles in household, the demographic groups most similar to Immigrants from Liberia are Immigrants from Colombia (5.4%, a difference of 0.040%), Immigrants from Croatia (5.4%, a difference of 0.13%), Venezuelan (5.3%, a difference of 0.32%), Brazilian (5.4%, a difference of 0.34%), and Immigrants from Bosnia and Herzegovina (5.3%, a difference of 0.46%).
| Demographics | Rating | Rank | 4 or more Vehicles in Household |
| Immigrants from Eastern Europe | 0.4 /100 | #278 | Tragic 5.4% |
| Immigrants from Uruguay | 0.3 /100 | #279 | Tragic 5.4% |
| Alsatians | 0.3 /100 | #280 | Tragic 5.4% |
| Immigrants from Western Africa | 0.3 /100 | #281 | Tragic 5.4% |
| Immigrants from Spain | 0.3 /100 | #282 | Tragic 5.4% |
| Immigrants from Ireland | 0.3 /100 | #283 | Tragic 5.4% |
| Brazilians | 0.3 /100 | #284 | Tragic 5.4% |
| Immigrants from Liberia | 0.2 /100 | #285 | Tragic 5.4% |
| Immigrants from Colombia | 0.2 /100 | #286 | Tragic 5.4% |
| Immigrants from Croatia | 0.2 /100 | #287 | Tragic 5.4% |
| Venezuelans | 0.2 /100 | #288 | Tragic 5.3% |
| Immigrants from Bosnia and Herzegovina | 0.2 /100 | #289 | Tragic 5.3% |
| Immigrants from Russia | 0.2 /100 | #290 | Tragic 5.3% |
| Immigrants from Bahamas | 0.1 /100 | #291 | Tragic 5.3% |
| Liberians | 0.1 /100 | #292 | Tragic 5.3% |
Immigrants from Liberia 4 or more Vehicles in Household Correlation Summary
| Measurement | Immigrants from Liberia Data | 4 or more Vehicles in Household Data |
| Minimum | 0.028% | 0.43% |
| Maximum | 15.3% | 15.1% |
| Range | 15.3% | 14.6% |
| Mean | 3.0% | 5.4% |
| Median | 2.3% | 5.2% |
| Interquartile 25% (IQ1) | 1.2% | 3.5% |
| Interquartile 75% (IQ3) | 4.0% | 6.6% |
| Interquartile Range (IQR) | 2.8% | 3.1% |
| Standard Deviation (Sample) | 2.8% | 2.8% |
| Standard Deviation (Population) | 2.8% | 2.7% |
Correlation Details
| Immigrants from Liberia Percentile | Sample Size | 4 or more Vehicles in Household |
[ 0.0% - 0.5% ] 0.028% | 92,427,433 | 5.1% |
[ 0.0% - 0.5% ] 0.11% | 16,873,720 | 5.7% |
[ 0.0% - 0.5% ] 0.19% | 8,253,340 | 6.1% |
[ 0.0% - 0.5% ] 0.26% | 4,334,572 | 5.4% |
[ 0.0% - 0.5% ] 0.35% | 4,456,028 | 3.8% |
[ 0.0% - 0.5% ] 0.42% | 1,550,522 | 6.0% |
[ 0.0% - 0.5% ] 0.50% | 1,687,024 | 6.0% |
[ 0.5% - 1.0% ] 0.57% | 910,570 | 5.9% |
[ 0.5% - 1.0% ] 0.66% | 493,688 | 7.3% |
[ 0.5% - 1.0% ] 0.73% | 373,724 | 7.7% |
[ 0.5% - 1.0% ] 0.80% | 335,805 | 6.2% |
[ 0.5% - 1.0% ] 0.89% | 181,982 | 8.6% |
[ 0.5% - 1.0% ] 0.96% | 446,405 | 5.6% |
[ 1.0% - 1.5% ] 1.03% | 347,729 | 6.3% |
[ 1.0% - 1.5% ] 1.11% | 103,306 | 7.1% |
[ 1.0% - 1.5% ] 1.20% | 517,521 | 3.2% |
[ 1.0% - 1.5% ] 1.26% | 89,285 | 3.5% |
[ 1.0% - 1.5% ] 1.34% | 107,193 | 5.3% |
[ 1.0% - 1.5% ] 1.42% | 121,884 | 4.9% |
[ 1.0% - 1.5% ] 1.48% | 8,705 | 11.4% |
[ 1.5% - 2.0% ] 1.57% | 19,930 | 5.2% |
[ 1.5% - 2.0% ] 1.64% | 113,593 | 3.8% |
[ 1.5% - 2.0% ] 1.72% | 176,668 | 4.7% |
[ 1.5% - 2.0% ] 1.81% | 42,534 | 2.8% |
[ 1.5% - 2.0% ] 1.89% | 56,572 | 4.6% |
[ 1.5% - 2.0% ] 1.94% | 23,101 | 3.1% |
[ 2.0% - 2.5% ] 2.03% | 9,507 | 13.8% |
[ 2.0% - 2.5% ] 2.10% | 52,655 | 7.2% |
[ 2.0% - 2.5% ] 2.17% | 47,729 | 4.2% |
[ 2.0% - 2.5% ] 2.25% | 33,620 | 3.0% |
[ 2.0% - 2.5% ] 2.34% | 95,009 | 6.0% |
[ 2.0% - 2.5% ] 2.40% | 91,692 | 3.7% |
[ 2.0% - 2.5% ] 2.49% | 6,295 | 0.43% |
[ 2.5% - 3.0% ] 2.55% | 50,464 | 3.0% |
[ 2.5% - 3.0% ] 2.67% | 12,017 | 1.4% |
[ 2.5% - 3.0% ] 2.73% | 13,811 | 4.3% |
[ 2.5% - 3.0% ] 2.83% | 5,234 | 15.1% |
[ 2.5% - 3.0% ] 2.87% | 35,244 | 7.8% |
[ 2.5% - 3.0% ] 2.95% | 1,730 | 6.7% |
[ 3.0% - 3.5% ] 3.08% | 15,709 | 3.5% |
[ 3.0% - 3.5% ] 3.25% | 30,544 | 4.6% |
[ 3.0% - 3.5% ] 3.34% | 8,596 | 6.4% |
[ 3.0% - 3.5% ] 3.39% | 48,577 | 3.3% |
[ 3.5% - 4.0% ] 3.66% | 23,363 | 8.8% |
[ 3.5% - 4.0% ] 3.78% | 32,912 | 8.0% |
[ 3.5% - 4.0% ] 3.86% | 1,425 | 3.3% |
[ 4.0% - 4.5% ] 4.10% | 11,051 | 6.5% |
[ 4.0% - 4.5% ] 4.27% | 14,550 | 2.9% |
[ 4.5% - 5.0% ] 4.60% | 22,337 | 3.1% |
[ 4.5% - 5.0% ] 4.76% | 21,620 | 3.0% |
[ 4.5% - 5.0% ] 4.93% | 23,804 | 4.6% |
[ 5.0% - 5.5% ] 5.14% | 84,951 | 8.8% |
[ 5.0% - 5.5% ] 5.35% | 37,169 | 7.1% |
[ 6.0% - 6.5% ] 6.12% | 32,967 | 3.9% |
[ 6.0% - 6.5% ] 6.49% | 22,493 | 4.0% |
[ 7.0% - 7.5% ] 7.11% | 13,075 | 10.4% |
[ 7.0% - 7.5% ] 7.38% | 35,780 | 1.1% |
[ 7.5% - 8.0% ] 7.91% | 28,392 | 5.9% |
[ 8.0% - 8.5% ] 8.07% | 10,682 | 3.7% |
[ 11.0% - 11.5% ] 11.15% | 3,156 | 0.92% |
[ 15.0% - 15.5% ] 15.34% | 2,849 | 5.6% |