Immigrants from Indonesia 2 or more Vehicles in Household
COMPARE
Immigrants from Indonesia
Select to Compare
2 or more Vehicles in Household
Immigrants from Indonesia 2 or more Vehicles in Household
57.6%
2+ VEHICLES AVAILABLE
98.2/ 100
METRIC RATING
104th/ 347
METRIC RANK
Immigrants from Indonesia 2 or more Vehicles in Household Correlation Chart
The statistical analysis conducted on geographies consisting of 215,617,231 people shows a mild positive correlation between the proportion of Immigrants from Indonesia and percentage of households with 2 or more vehicles available in the United States with a correlation coefficient (R) of 0.327 and weighted average of 57.6%. On average, for every 1% (one percent) increase in Immigrants from Indonesia within a typical geography, there is an increase of 1.9% in percentage of households with 2 or more vehicles available.
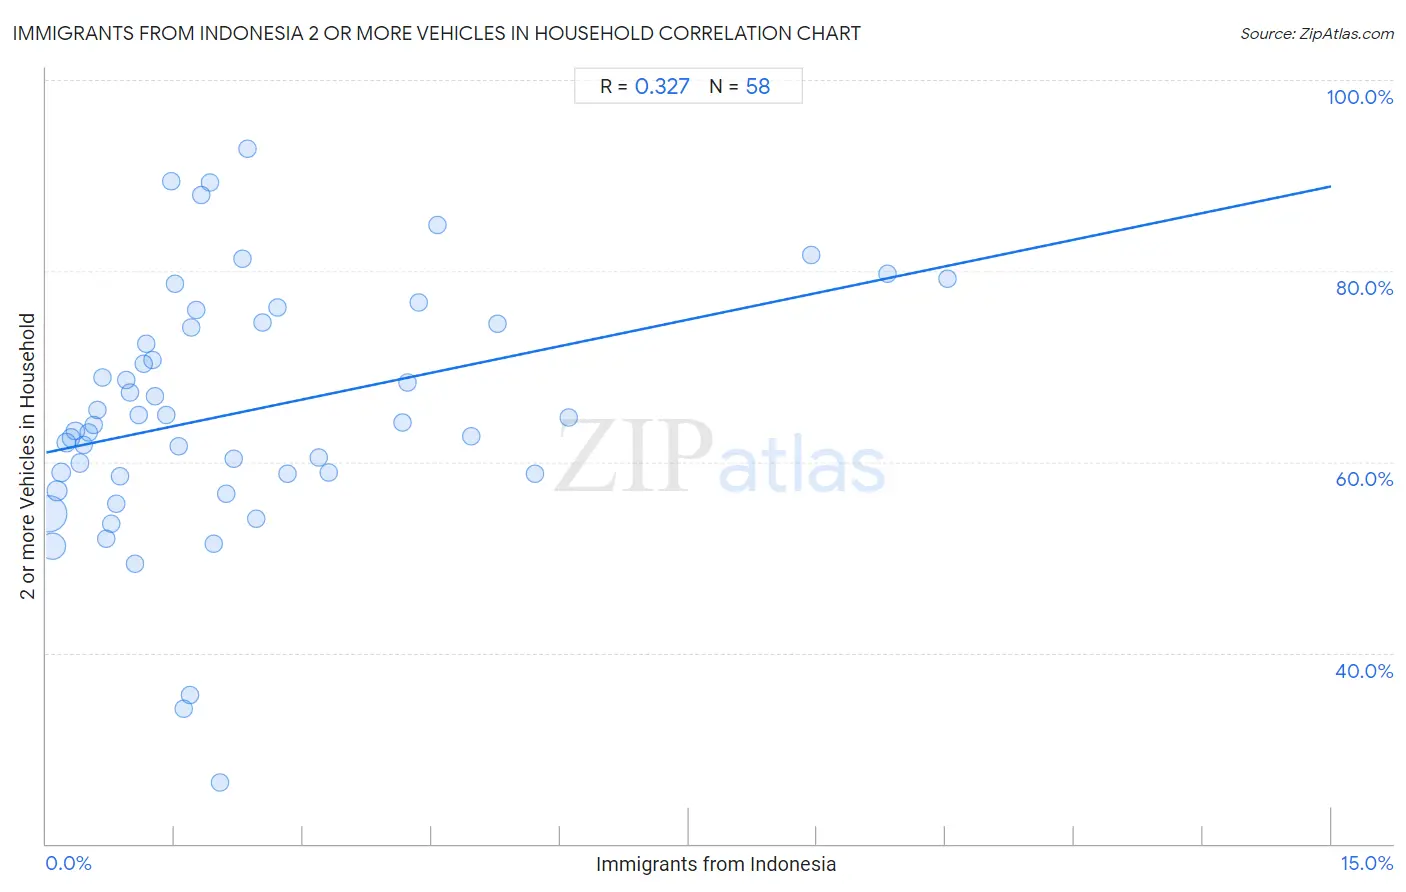
It is essential to understand that the correlation between the percentage of Immigrants from Indonesia and percentage of households with 2 or more vehicles available does not imply a direct cause-and-effect relationship. It remains uncertain whether the presence of Immigrants from Indonesia influences an upward or downward trend in the level of percentage of households with 2 or more vehicles available within an area, or if Immigrants from Indonesia simply ended up residing in those areas with higher or lower levels of percentage of households with 2 or more vehicles available due to other factors.
Demographics Similar to Immigrants from Indonesia by 2 or more Vehicles in Household
In terms of 2 or more vehicles in household, the demographic groups most similar to Immigrants from Indonesia are Immigrants from Bolivia (57.6%, a difference of 0.0%), Jordanian (57.6%, a difference of 0.0%), Immigrants from Korea (57.6%, a difference of 0.0%), Immigrants from Oceania (57.5%, a difference of 0.020%), and Immigrants from Netherlands (57.5%, a difference of 0.040%).
| Demographics | Rating | Rank | 2 or more Vehicles in Household |
| Slavs | 98.8 /100 | #97 | Exceptional 57.8% |
| Palestinians | 98.6 /100 | #98 | Exceptional 57.7% |
| Cajuns | 98.5 /100 | #99 | Exceptional 57.7% |
| Fijians | 98.4 /100 | #100 | Exceptional 57.6% |
| Lebanese | 98.3 /100 | #101 | Exceptional 57.6% |
| Immigrants from Bolivia | 98.2 /100 | #102 | Exceptional 57.6% |
| Jordanians | 98.2 /100 | #103 | Exceptional 57.6% |
| Immigrants from Indonesia | 98.2 /100 | #104 | Exceptional 57.6% |
| Immigrants from Korea | 98.2 /100 | #105 | Exceptional 57.6% |
| Immigrants from Oceania | 98.2 /100 | #106 | Exceptional 57.5% |
| Immigrants from Netherlands | 98.2 /100 | #107 | Exceptional 57.5% |
| Immigrants from Canada | 98.1 /100 | #108 | Exceptional 57.5% |
| Immigrants from North America | 98.1 /100 | #109 | Exceptional 57.5% |
| Japanese | 98.0 /100 | #110 | Exceptional 57.5% |
| Greeks | 98.0 /100 | #111 | Exceptional 57.5% |
Immigrants from Indonesia 2 or more Vehicles in Household Correlation Summary
| Measurement | Immigrants from Indonesia Data | 2 or more Vehicles in Household Data |
| Minimum | 0.025% | 26.4% |
| Maximum | 10.5% | 92.7% |
| Range | 10.5% | 66.4% |
| Mean | 2.3% | 65.2% |
| Median | 1.6% | 64.0% |
| Interquartile 25% (IQ1) | 0.75% | 58.7% |
| Interquartile 75% (IQ3) | 2.7% | 74.4% |
| Interquartile Range (IQR) | 1.9% | 15.7% |
| Standard Deviation (Sample) | 2.3% | 13.1% |
| Standard Deviation (Population) | 2.3% | 13.0% |
Correlation Details
| Immigrants from Indonesia Percentile | Sample Size | 2 or more Vehicles in Household |
[ 0.0% - 0.5% ] 0.025% | 113,816,663 | 54.5% |
[ 0.0% - 0.5% ] 0.075% | 53,794,494 | 51.1% |
[ 0.0% - 0.5% ] 0.13% | 20,842,632 | 57.0% |
[ 0.0% - 0.5% ] 0.18% | 8,295,546 | 58.9% |
[ 0.0% - 0.5% ] 0.24% | 6,228,782 | 62.1% |
[ 0.0% - 0.5% ] 0.29% | 2,911,790 | 62.5% |
[ 0.0% - 0.5% ] 0.34% | 3,241,833 | 63.2% |
[ 0.0% - 0.5% ] 0.39% | 1,371,621 | 59.9% |
[ 0.0% - 0.5% ] 0.44% | 1,001,427 | 61.8% |
[ 0.5% - 1.0% ] 0.50% | 623,037 | 63.1% |
[ 0.5% - 1.0% ] 0.55% | 677,470 | 63.9% |
[ 0.5% - 1.0% ] 0.60% | 724,963 | 65.5% |
[ 0.5% - 1.0% ] 0.66% | 473,086 | 68.8% |
[ 0.5% - 1.0% ] 0.71% | 311,745 | 51.9% |
[ 0.5% - 1.0% ] 0.75% | 247,842 | 53.5% |
[ 0.5% - 1.0% ] 0.81% | 78,346 | 55.7% |
[ 0.5% - 1.0% ] 0.86% | 210,643 | 58.5% |
[ 0.5% - 1.0% ] 0.93% | 90,850 | 68.6% |
[ 0.5% - 1.0% ] 0.97% | 75,843 | 67.3% |
[ 1.0% - 1.5% ] 1.04% | 25,174 | 49.3% |
[ 1.0% - 1.5% ] 1.08% | 19,188 | 64.9% |
[ 1.0% - 1.5% ] 1.13% | 122,247 | 70.3% |
[ 1.0% - 1.5% ] 1.17% | 59,795 | 72.4% |
[ 1.0% - 1.5% ] 1.24% | 57,812 | 70.7% |
[ 1.0% - 1.5% ] 1.27% | 12,762 | 66.9% |
[ 1.0% - 1.5% ] 1.40% | 4,496 | 64.9% |
[ 1.0% - 1.5% ] 1.46% | 2,949 | 89.4% |
[ 1.5% - 2.0% ] 1.50% | 2,860 | 78.7% |
[ 1.5% - 2.0% ] 1.55% | 12,166 | 61.6% |
[ 1.5% - 2.0% ] 1.61% | 4,718 | 34.1% |
[ 1.5% - 2.0% ] 1.67% | 68,325 | 35.6% |
[ 1.5% - 2.0% ] 1.69% | 2,538 | 74.1% |
[ 1.5% - 2.0% ] 1.76% | 55,333 | 76.0% |
[ 1.5% - 2.0% ] 1.82% | 2,368 | 88.0% |
[ 1.5% - 2.0% ] 1.92% | 1,462 | 89.3% |
[ 1.5% - 2.0% ] 1.95% | 205 | 51.5% |
[ 2.0% - 2.5% ] 2.02% | 44,107 | 26.4% |
[ 2.0% - 2.5% ] 2.10% | 286 | 56.7% |
[ 2.0% - 2.5% ] 2.18% | 30,255 | 60.3% |
[ 2.0% - 2.5% ] 2.29% | 6,154 | 81.2% |
[ 2.0% - 2.5% ] 2.35% | 1,746 | 92.7% |
[ 2.0% - 2.5% ] 2.46% | 4,150 | 54.0% |
[ 2.5% - 3.0% ] 2.52% | 1,983 | 74.6% |
[ 2.5% - 3.0% ] 2.70% | 10,918 | 76.1% |
[ 2.5% - 3.0% ] 2.82% | 12,478 | 58.8% |
[ 3.0% - 3.5% ] 3.18% | 472 | 60.4% |
[ 3.0% - 3.5% ] 3.29% | 23,054 | 58.9% |
[ 4.0% - 4.5% ] 4.16% | 985 | 64.2% |
[ 4.0% - 4.5% ] 4.22% | 1,138 | 68.3% |
[ 4.0% - 4.5% ] 4.35% | 1,012 | 76.7% |
[ 4.5% - 5.0% ] 4.57% | 634 | 84.8% |
[ 4.5% - 5.0% ] 4.95% | 222 | 62.7% |
[ 5.0% - 5.5% ] 5.26% | 171 | 74.4% |
[ 5.5% - 6.0% ] 5.70% | 193 | 58.7% |
[ 6.0% - 6.5% ] 6.10% | 738 | 64.7% |
[ 8.5% - 9.0% ] 8.94% | 1,634 | 81.7% |
[ 9.5% - 10.0% ] 9.83% | 977 | 79.8% |
[ 10.5% - 11.0% ] 10.51% | 913 | 79.2% |