Immigrants from Indonesia vs Immigrants from Kazakhstan Disability Age 5 to 17

COMPARE

Immigrants from Indonesia
Race
Ancestry
AfghanAfricanAlaska NativeAlaskan AthabascanAlbanianAleutAlsatianAmericanApacheArabArapahoArgentineanArmenianAssyrian/Chaldean/SyriacAustralianAustrianBahamianBangladeshiBarbadianBasqueBelgianBelizeanBermudanBhutaneseBlackfeetBolivianBrazilianBritishBritish West IndianBulgarianBurmeseCajunCambodianCanadianCape VerdeanCarpatho RusynCelticCentral AmericanCentral American IndianCherokeeCheyenneChickasawChileanChineseChippewaChoctawColombianColvilleComancheCosta RicanCreeCreekCroatianCrowCubanCypriotCzechCzechoslovakianDanishDelawareDominicanDutchDutch West IndianEastern EuropeanEcuadorianEgyptianEnglishEstonianEthiopianEuropeanFijianFilipinoFinnishFrenchFrench American IndianFrench CanadianGermanGerman RussianGhanaianGreekGuamanian/ChamorroGuatemalanGuyaneseHaitianHmongHonduranHopiHoumaHungarianIcelanderIndian (Asian)IndonesianInupiatIranianIraqiIrishIroquoisIsraeliItalianJamaicanJapaneseJordanianKenyanKiowaKoreanLaotianLatvianLebaneseLiberianLithuanianLumbeeLuxembourgerMacedonianMalaysianMalteseMarshalleseMenomineeMexicanMexican American IndianMongolianMoroccanNative HawaiianNavajoNepaleseNew ZealanderNicaraguanNigerianNorthern EuropeanNorwegianOkinawanOsageOttawaPaiutePakistaniPalestinianPanamanianParaguayanPennsylvania GermanPeruvianPimaPolishPortuguesePotawatomiPuebloPuerto RicanPuget Sound SalishRomanianRussianSalvadoranSamoanScandinavianScotch-IrishScottishSeminoleSenegaleseSerbianShoshoneSierra LeoneanSiouxSlavicSlovakSloveneSomaliSouth AfricanSouth AmericanSouth American IndianSoviet UnionSpaniardSpanishSpanish AmericanSpanish American IndianSri LankanSubsaharan AfricanSudaneseSwedishSwissSyrianTaiwaneseThaiTlingit-HaidaTohono O'OdhamTonganTrinidadian and TobagonianTsimshianTurkishU.S. Virgin IslanderUgandanUkrainianUruguayanUteVenezuelanVietnameseWelshWest IndianYakamaYaquiYugoslavianYumanYup'ikZimbabwean
Immigration
NonimmigrantsImmigrantsAfghanistanAfricaAlbaniaArgentinaArmeniaAsiaAustraliaAustriaBahamasBangladeshBarbadosBelarusBelgiumBelizeBoliviaBosnia and HerzegovinaBrazilBulgariaBurma/MyanmarCabo VerdeCambodiaCameroonCanadaCaribbeanCentral AmericaChileChinaColombiaCongoCosta RicaCroatiaCubaCzechoslovakiaDenmarkDominicaDominican RepublicEastern AfricaEastern AsiaEastern EuropeEcuadorEgyptEl SalvadorEnglandEritreaEthiopiaEuropeFijiFranceGermanyGhanaGreeceGrenadaGuatemalaGuyanaHaitiHondurasHong KongHungaryIndiaIndonesiaIranIraqIrelandIsraelItalyJamaicaJapanJordanKenyaKoreaKuwaitLaosLatin AmericaLatviaLebanonLiberiaLithuaniaMalaysiaMexicoMicronesiaMiddle AfricaMoldovaMoroccoNepalNetherlandsNicaraguaNigeriaNorth AmericaNorth MacedoniaNorthern AfricaNorthern EuropeNorwayOceaniaPakistanPanamaPeruPhilippinesPolandPortugalRomaniaRussiaSaudi ArabiaScotlandSenegalSerbiaSierra LeoneSingaporeSomaliaSouth AfricaSouth AmericaSouth Central AsiaSouth Eastern AsiaSouthern EuropeSpainSri LankaSt. Vincent and the GrenadinesSudanSwedenSwitzerlandSyriaTaiwanThailandTrinidad and TobagoTurkeyUgandaUkraineUruguayUzbekistanVenezuelaVietnamWest IndiesWestern AfricaWestern AsiaWestern EuropeYemenZaireZimbabweAzores
Immigrants from Kazakhstan
Race
Ancestry
AfghanAfricanAlaska NativeAlaskan AthabascanAlbanianAleutAlsatianAmericanApacheArabArapahoArgentineanArmenianAssyrian/Chaldean/SyriacAustralianAustrianBahamianBangladeshiBarbadianBasqueBelgianBelizeanBermudanBhutaneseBlackfeetBolivianBrazilianBritishBritish West IndianBulgarianBurmeseCajunCambodianCanadianCape VerdeanCarpatho RusynCelticCentral AmericanCentral American IndianCherokeeCheyenneChickasawChileanChineseChippewaChoctawColombianColvilleComancheCosta RicanCreeCreekCroatianCrowCubanCypriotCzechCzechoslovakianDanishDelawareDominicanDutchDutch West IndianEastern EuropeanEcuadorianEgyptianEnglishEstonianEthiopianEuropeanFijianFilipinoFinnishFrenchFrench American IndianFrench CanadianGermanGerman RussianGhanaianGreekGuamanian/ChamorroGuatemalanGuyaneseHaitianHmongHonduranHopiHoumaHungarianIcelanderIndian (Asian)IndonesianInupiatIranianIraqiIrishIroquoisIsraeliItalianJamaicanJapaneseJordanianKenyanKiowaKoreanLaotianLatvianLebaneseLiberianLithuanianLumbeeLuxembourgerMacedonianMalaysianMalteseMarshalleseMenomineeMexicanMexican American IndianMongolianMoroccanNative HawaiianNavajoNepaleseNew ZealanderNicaraguanNigerianNorthern EuropeanNorwegianOkinawanOsageOttawaPaiutePakistaniPalestinianPanamanianParaguayanPennsylvania GermanPeruvianPimaPolishPortuguesePotawatomiPuebloPuerto RicanPuget Sound SalishRomanianRussianSalvadoranSamoanScandinavianScotch-IrishScottishSeminoleSenegaleseSerbianShoshoneSierra LeoneanSiouxSlavicSlovakSloveneSomaliSouth AfricanSouth AmericanSouth American IndianSoviet UnionSpaniardSpanishSpanish AmericanSpanish American IndianSri LankanSubsaharan AfricanSudaneseSwedishSwissSyrianTaiwaneseThaiTlingit-HaidaTohono O'OdhamTonganTrinidadian and TobagonianTsimshianTurkishU.S. Virgin IslanderUgandanUkrainianUruguayanUteVenezuelanVietnameseWelshWest IndianYakamaYaquiYugoslavianYumanYup'ikZimbabwean
Immigration
NonimmigrantsImmigrantsAfghanistanAfricaAlbaniaArgentinaArmeniaAsiaAustraliaAustriaBahamasBangladeshBarbadosBelarusBelgiumBelizeBoliviaBosnia and HerzegovinaBrazilBulgariaBurma/MyanmarCabo VerdeCambodiaCameroonCanadaCaribbeanCentral AmericaChileChinaColombiaCongoCosta RicaCroatiaCubaCzechoslovakiaDenmarkDominicaDominican RepublicEastern AfricaEastern AsiaEastern EuropeEcuadorEgyptEl SalvadorEnglandEritreaEthiopiaEuropeFijiFranceGermanyGhanaGreeceGrenadaGuatemalaGuyanaHaitiHondurasHong KongHungaryIndiaIranIraqIrelandIsraelItalyJamaicaJapanJordanKazakhstanKenyaKoreaKuwaitLaosLatin AmericaLatviaLebanonLiberiaLithuaniaMalaysiaMexicoMicronesiaMiddle AfricaMoldovaMoroccoNepalNetherlandsNicaraguaNigeriaNorth AmericaNorth MacedoniaNorthern AfricaNorthern EuropeNorwayOceaniaPakistanPanamaPeruPhilippinesPolandPortugalRomaniaRussiaSaudi ArabiaScotlandSenegalSerbiaSierra LeoneSingaporeSomaliaSouth AfricaSouth AmericaSouth Central AsiaSouth Eastern AsiaSouthern EuropeSpainSri LankaSt. Vincent and the GrenadinesSudanSwedenSwitzerlandSyriaTaiwanThailandTrinidad and TobagoTurkeyUgandaUkraineUruguayUzbekistanVenezuelaVietnamWest IndiesWestern AfricaWestern AsiaWestern EuropeYemenZaireZimbabweAzores
Disability Age 5 to 17
Income
Poverty
Unemployment
Labor Participation
Family Structure
Vehicle Availability
Education Level
Disability

Disability Age 5 to 17 Comparison

Immigrants from Indonesia

Immigrants from Kazakhstan

Exceptional
Exceptional
5.0%
DISABILITY AGE 5 TO 17
100.0/ 100
METRIC RATING
33rd/ 347
METRIC RANK
5.2%
DISABILITY AGE 5 TO 17
99.6/ 100
METRIC RATING
77th/ 347
METRIC RANK

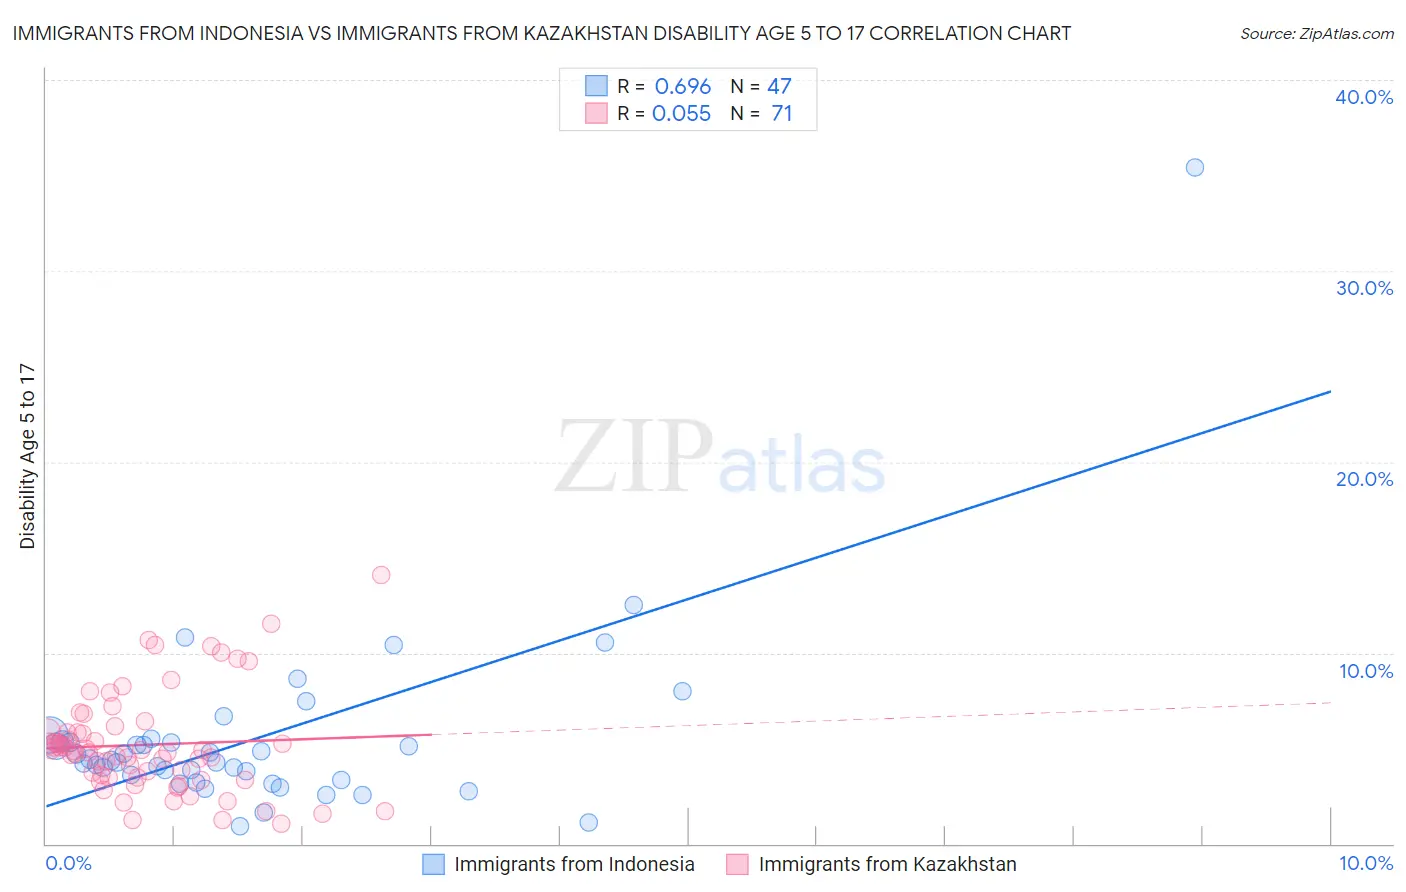
Immigrants from Indonesia vs Immigrants from Kazakhstan Disability Age 5 to 17 Correlation Chart

The statistical analysis conducted on geographies consisting of 214,816,459 people shows a significant positive correlation between the proportion of Immigrants from Indonesia and percentage of population with a disability between the ages 5 and 17 in the United States with a correlation coefficient (R) of 0.696 and weighted average of 5.0%. Similarly, the statistical analysis conducted on geographies consisting of 124,141,808 people shows a slight positive correlation between the proportion of Immigrants from Kazakhstan and percentage of population with a disability between the ages 5 and 17 in the United States with a correlation coefficient (R) of 0.055 and weighted average of 5.2%, a difference of 4.6%.
Immigrants from Indonesia vs Immigrants from Kazakhstan Disability Age 5 to 17

Disability Age 5 to 17 Correlation Summary

MeasurementImmigrants from IndonesiaImmigrants from Kazakhstan
Minimum0.90%1.1%
Maximum35.4%14.1%
Range34.5%13.0%
Mean5.5%5.2%
Median4.4%4.8%
Interquartile 25% (IQ1)3.3%3.5%
Interquartile 75% (IQ3)5.4%5.9%
Interquartile Range (IQR)2.0%2.4%
Standard Deviation (Sample)5.1%2.6%
Standard Deviation (Population)5.0%2.6%

Similar Demographics by Disability Age 5 to 17

Demographics Similar to Immigrants from Indonesia by Disability Age 5 to 17

In terms of disability age 5 to 17, the demographic groups most similar to Immigrants from Indonesia are Israeli (5.0%, a difference of 0.12%), Bolivian (5.0%, a difference of 0.30%), Soviet Union (5.0%, a difference of 0.32%), Immigrants from Egypt (5.0%, a difference of 0.35%), and Immigrants from Pakistan (5.0%, a difference of 0.36%).
DemographicsRating | RankDisability Age 5 to 17
Bhutanese
100.0
/100
|
#26
Exceptional
4.9%
Taiwanese
100.0
/100
|
#27
Exceptional
4.9%
Immigrants | Japan
100.0
/100
|
#28
Exceptional
4.9%
Immigrants | Serbia
100.0
/100
|
#29
Exceptional
4.9%
Immigrants | Malaysia
100.0
/100
|
#30
Exceptional
5.0%
Immigrants | Pakistan
100.0
/100
|
#31
Exceptional
5.0%
Soviet Union
100.0
/100
|
#32
Exceptional
5.0%
Immigrants | Indonesia
100.0
/100
|
#33
Exceptional
5.0%
Israelis
100.0
/100
|
#34
Exceptional
5.0%
Bolivians
100.0
/100
|
#35
Exceptional
5.0%
Immigrants | Egypt
100.0
/100
|
#36
Exceptional
5.0%
Immigrants | Belarus
100.0
/100
|
#37
Exceptional
5.0%
Immigrants | Philippines
100.0
/100
|
#38
Exceptional
5.0%
Immigrants | Argentina
100.0
/100
|
#39
Exceptional
5.0%
Okinawans
100.0
/100
|
#40
Exceptional
5.0%

Demographics Similar to Immigrants from Kazakhstan by Disability Age 5 to 17

In terms of disability age 5 to 17, the demographic groups most similar to Immigrants from Kazakhstan are Immigrants from Cuba (5.2%, a difference of 0.010%), Immigrants from Guyana (5.2%, a difference of 0.030%), Afghan (5.2%, a difference of 0.050%), Immigrants from Moldova (5.2%, a difference of 0.070%), and Sri Lankan (5.2%, a difference of 0.070%).
DemographicsRating | RankDisability Age 5 to 17
Immigrants | Belgium
99.7
/100
|
#70
Exceptional
5.2%
Jordanians
99.7
/100
|
#71
Exceptional
5.2%
Immigrants | Vietnam
99.7
/100
|
#72
Exceptional
5.2%
Immigrants | Czechoslovakia
99.7
/100
|
#73
Exceptional
5.2%
Immigrants | Romania
99.7
/100
|
#74
Exceptional
5.2%
Immigrants | Moldova
99.6
/100
|
#75
Exceptional
5.2%
Immigrants | Guyana
99.6
/100
|
#76
Exceptional
5.2%
Immigrants | Kazakhstan
99.6
/100
|
#77
Exceptional
5.2%
Immigrants | Cuba
99.6
/100
|
#78
Exceptional
5.2%
Afghans
99.6
/100
|
#79
Exceptional
5.2%
Sri Lankans
99.6
/100
|
#80
Exceptional
5.2%
Native Hawaiians
99.6
/100
|
#81
Exceptional
5.2%
Immigrants | Sweden
99.5
/100
|
#82
Exceptional
5.2%
Immigrants | France
99.5
/100
|
#83
Exceptional
5.2%
Immigrants | Nicaragua
99.5
/100
|
#84
Exceptional
5.2%