Immigrants from Indonesia Married-Couple Family Poverty

COMPARE

Immigrants from Indonesia
Race
Ancestry
AfghanAfricanAlaska NativeAlaskan AthabascanAlbanianAleutAlsatianAmericanApacheArabArapahoArgentineanArmenianAssyrian/Chaldean/SyriacAustralianAustrianBahamianBangladeshiBarbadianBasqueBelgianBelizeanBermudanBhutaneseBlackfeetBolivianBrazilianBritishBritish West IndianBulgarianBurmeseCajunCambodianCanadianCape VerdeanCarpatho RusynCelticCentral AmericanCentral American IndianCherokeeCheyenneChickasawChileanChineseChippewaChoctawColombianColvilleComancheCosta RicanCreeCreekCroatianCrowCubanCypriotCzechCzechoslovakianDanishDelawareDominicanDutchDutch West IndianEastern EuropeanEcuadorianEgyptianEnglishEstonianEthiopianEuropeanFijianFilipinoFinnishFrenchFrench American IndianFrench CanadianGermanGerman RussianGhanaianGreekGuamanian/ChamorroGuatemalanGuyaneseHaitianHmongHonduranHopiHoumaHungarianIcelanderIndian (Asian)IndonesianInupiatIranianIraqiIrishIroquoisIsraeliItalianJamaicanJapaneseJordanianKenyanKiowaKoreanLaotianLatvianLebaneseLiberianLithuanianLumbeeLuxembourgerMacedonianMalaysianMalteseMarshalleseMenomineeMexicanMexican American IndianMongolianMoroccanNative HawaiianNavajoNepaleseNew ZealanderNicaraguanNigerianNorthern EuropeanNorwegianOkinawanOsageOttawaPaiutePakistaniPalestinianPanamanianParaguayanPennsylvania GermanPeruvianPimaPolishPortuguesePotawatomiPuebloPuerto RicanPuget Sound SalishRomanianRussianSalvadoranSamoanScandinavianScotch-IrishScottishSeminoleSenegaleseSerbianShoshoneSierra LeoneanSiouxSlavicSlovakSloveneSomaliSouth AfricanSouth AmericanSouth American IndianSoviet UnionSpaniardSpanishSpanish AmericanSpanish American IndianSri LankanSubsaharan AfricanSudaneseSwedishSwissSyrianTaiwaneseThaiTlingit-HaidaTohono O'OdhamTonganTrinidadian and TobagonianTsimshianTurkishU.S. Virgin IslanderUgandanUkrainianUruguayanUteVenezuelanVietnameseWelshWest IndianYakamaYaquiYugoslavianYumanYup'ikZimbabwean
Immigration
NonimmigrantsImmigrantsAfghanistanAfricaAlbaniaArgentinaArmeniaAsiaAustraliaAustriaBahamasBangladeshBarbadosBelarusBelgiumBelizeBoliviaBosnia and HerzegovinaBrazilBulgariaBurma/MyanmarCabo VerdeCambodiaCameroonCanadaCaribbeanCentral AmericaChileChinaColombiaCongoCosta RicaCroatiaCubaCzechoslovakiaDenmarkDominicaDominican RepublicEastern AfricaEastern AsiaEastern EuropeEcuadorEgyptEl SalvadorEnglandEritreaEthiopiaEuropeFijiFranceGermanyGhanaGreeceGrenadaGuatemalaGuyanaHaitiHondurasHong KongHungaryIndiaIndonesiaIranIraqIrelandIsraelItalyJamaicaJapanJordanKazakhstanKenyaKoreaKuwaitLaosLatin AmericaLatviaLebanonLiberiaLithuaniaMalaysiaMexicoMicronesiaMiddle AfricaMoldovaMoroccoNepalNetherlandsNicaraguaNigeriaNorth AmericaNorth MacedoniaNorthern AfricaNorthern EuropeNorwayOceaniaPakistanPanamaPeruPhilippinesPolandPortugalRomaniaRussiaSaudi ArabiaScotlandSenegalSerbiaSierra LeoneSingaporeSomaliaSouth AfricaSouth AmericaSouth Central AsiaSouth Eastern AsiaSouthern EuropeSpainSri LankaSt. Vincent and the GrenadinesSudanSwedenSwitzerlandSyriaTaiwanThailandTrinidad and TobagoTurkeyUgandaUkraineUruguayUzbekistanVenezuelaVietnamWest IndiesWestern AfricaWestern AsiaWestern EuropeYemenZaireZimbabweAzores
Select to Compare
Race
Ancestry
AfghanAfricanAlaska NativeAlaskan AthabascanAlbanianAleutAlsatianAmericanApacheArabArapahoArgentineanArmenianAssyrian/Chaldean/SyriacAustralianAustrianBahamianBangladeshiBarbadianBasqueBelgianBelizeanBermudanBhutaneseBlackfeetBolivianBrazilianBritishBritish West IndianBulgarianBurmeseCajunCambodianCanadianCape VerdeanCarpatho RusynCelticCentral AmericanCentral American IndianCherokeeCheyenneChickasawChileanChineseChippewaChoctawColombianColvilleComancheCosta RicanCreeCreekCroatianCrowCubanCypriotCzechCzechoslovakianDanishDelawareDominicanDutchDutch West IndianEastern EuropeanEcuadorianEgyptianEnglishEstonianEthiopianEuropeanFijianFilipinoFinnishFrenchFrench American IndianFrench CanadianGermanGerman RussianGhanaianGreekGuamanian/ChamorroGuatemalanGuyaneseHaitianHmongHonduranHopiHoumaHungarianIcelanderIndian (Asian)IndonesianInupiatIranianIraqiIrishIroquoisIsraeliItalianJamaicanJapaneseJordanianKenyanKiowaKoreanLaotianLatvianLebaneseLiberianLithuanianLumbeeLuxembourgerMacedonianMalaysianMalteseMarshalleseMenomineeMexicanMexican American IndianMongolianMoroccanNative HawaiianNavajoNepaleseNew ZealanderNicaraguanNigerianNorthern EuropeanNorwegianOkinawanOsageOttawaPaiutePakistaniPalestinianPanamanianParaguayanPennsylvania GermanPeruvianPimaPolishPortuguesePotawatomiPuebloPuerto RicanPuget Sound SalishRomanianRussianSalvadoranSamoanScandinavianScotch-IrishScottishSeminoleSenegaleseSerbianShoshoneSierra LeoneanSiouxSlavicSlovakSloveneSomaliSouth AfricanSouth AmericanSouth American IndianSoviet UnionSpaniardSpanishSpanish AmericanSpanish American IndianSri LankanSubsaharan AfricanSudaneseSwedishSwissSyrianTaiwaneseThaiTlingit-HaidaTohono O'OdhamTonganTrinidadian and TobagonianTsimshianTurkishU.S. Virgin IslanderUgandanUkrainianUruguayanUteVenezuelanVietnameseWelshWest IndianYakamaYaquiYugoslavianYumanYup'ikZimbabwean
Immigration
NonimmigrantsImmigrantsAfghanistanAfricaAlbaniaArgentinaArmeniaAsiaAustraliaAustriaBahamasBangladeshBarbadosBelarusBelgiumBelizeBoliviaBosnia and HerzegovinaBrazilBulgariaBurma/MyanmarCabo VerdeCambodiaCameroonCanadaCaribbeanCentral AmericaChileChinaColombiaCongoCosta RicaCroatiaCubaCzechoslovakiaDenmarkDominicaDominican RepublicEastern AfricaEastern AsiaEastern EuropeEcuadorEgyptEl SalvadorEnglandEritreaEthiopiaEuropeFijiFranceGermanyGhanaGreeceGrenadaGuatemalaGuyanaHaitiHondurasHong KongHungaryIndiaIranIraqIrelandIsraelItalyJamaicaJapanJordanKazakhstanKenyaKoreaKuwaitLaosLatin AmericaLatviaLebanonLiberiaLithuaniaMalaysiaMexicoMicronesiaMiddle AfricaMoldovaMoroccoNepalNetherlandsNicaraguaNigeriaNorth AmericaNorth MacedoniaNorthern AfricaNorthern EuropeNorwayOceaniaPakistanPanamaPeruPhilippinesPolandPortugalRomaniaRussiaSaudi ArabiaScotlandSenegalSerbiaSierra LeoneSingaporeSomaliaSouth AfricaSouth AmericaSouth Central AsiaSouth Eastern AsiaSouthern EuropeSpainSri LankaSt. Vincent and the GrenadinesSudanSwedenSwitzerlandSyriaTaiwanThailandTrinidad and TobagoTurkeyUgandaUkraineUruguayUzbekistanVenezuelaVietnamWest IndiesWestern AfricaWestern AsiaWestern EuropeYemenZaireZimbabweAzores
Married-Couple Family Poverty
Income
Poverty
Unemployment
Labor Participation
Family Structure
Vehicle Availability
Education Level
Disability

Immigrants from Indonesia Married-Couple Family Poverty
Exceptional

4.8%
POVERTY | MARRIED-COUPLE FAMILIES
95.1/ 100
METRIC RATING
114th/ 347
METRIC RANK

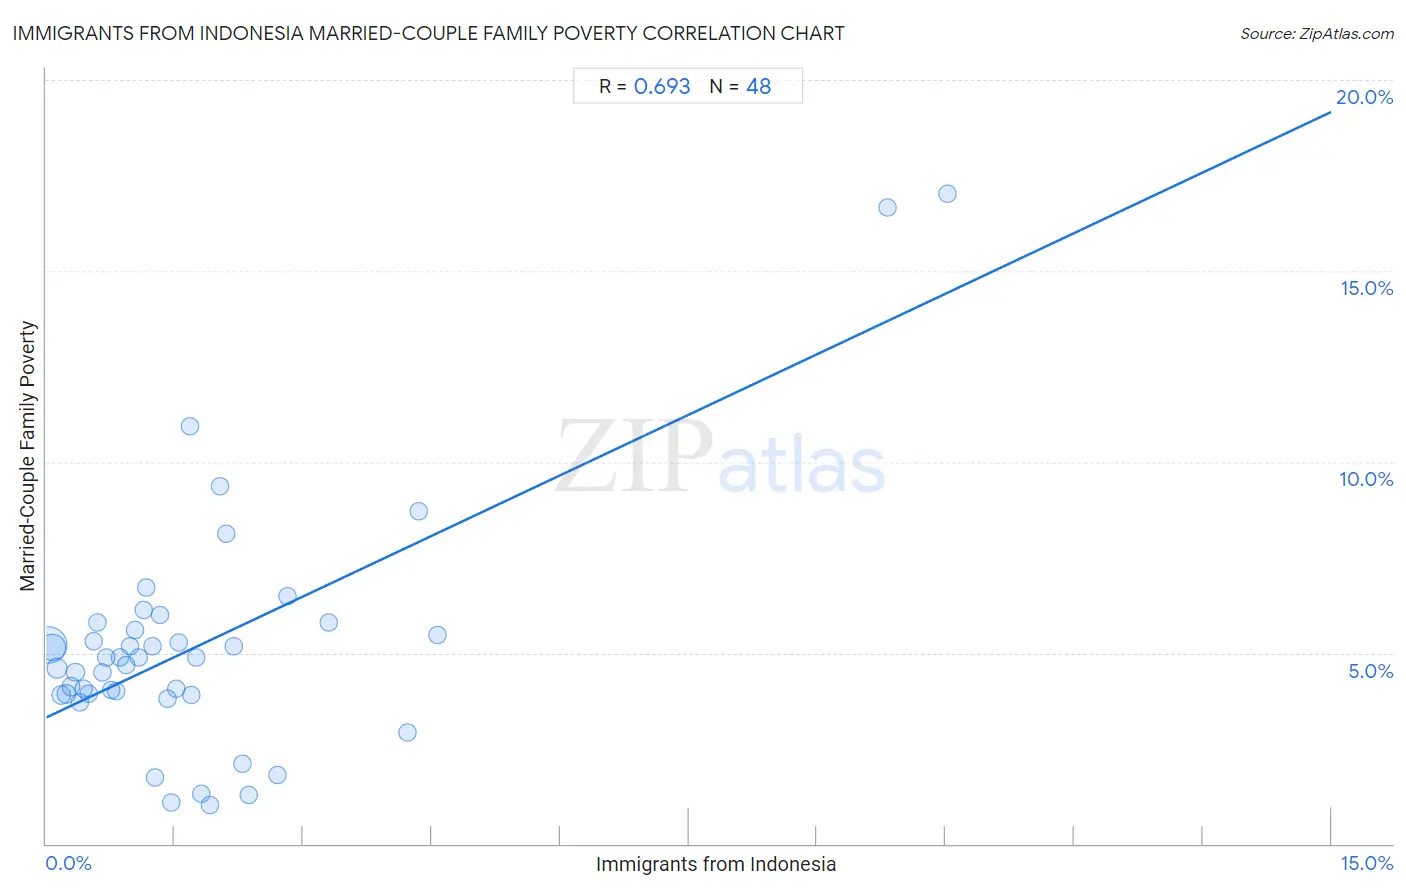
Immigrants from Indonesia Married-Couple Family Poverty Correlation Chart

The statistical analysis conducted on geographies consisting of 214,935,833 people shows a significant positive correlation between the proportion of Immigrants from Indonesia and poverty level among married-couple families in the United States with a correlation coefficient (R) of 0.693 and weighted average of 4.8%. On average, for every 1% (one percent) increase in Immigrants from Indonesia within a typical geography, there is an increase of 1.1% in poverty level among married-couple families.
Immigrants from Indonesia Married-Couple Family Poverty
It is essential to understand that the correlation between the percentage of Immigrants from Indonesia and poverty level among married-couple families does not imply a direct cause-and-effect relationship. It remains uncertain whether the presence of Immigrants from Indonesia influences an upward or downward trend in the level of poverty level among married-couple families within an area, or if Immigrants from Indonesia simply ended up residing in those areas with higher or lower levels of poverty level among married-couple families due to other factors.

Demographics Similar to Immigrants from Indonesia by Married-Couple Family Poverty

In terms of married-couple family poverty, the demographic groups most similar to Immigrants from Indonesia are Taiwanese (4.8%, a difference of 0.15%), Celtic (4.8%, a difference of 0.16%), Kenyan (4.8%, a difference of 0.26%), Immigrants from Philippines (4.8%, a difference of 0.28%), and Immigrants from Nepal (4.7%, a difference of 0.58%).
DemographicsRating | RankMarried-Couple Family Poverty
Immigrants from Germany
96.8
/100
|
#107
Exceptional
4.7%
Laotians
96.6
/100
|
#108
Exceptional
4.7%
Immigrants from Hong Kong
96.4
/100
|
#109
Exceptional
4.7%
Immigrants from Bolivia
96.2
/100
|
#110
Exceptional
4.7%
Pakistanis
96.2
/100
|
#111
Exceptional
4.7%
Tongans
95.9
/100
|
#112
Exceptional
4.7%
Immigrants from Nepal
95.9
/100
|
#113
Exceptional
4.7%
Immigrants from Indonesia
95.1
/100
|
#114
Exceptional
4.8%
Taiwanese
94.8
/100
|
#115
Exceptional
4.8%
Celtics
94.8
/100
|
#116
Exceptional
4.8%
Kenyans
94.7
/100
|
#117
Exceptional
4.8%
Immigrants from Philippines
94.6
/100
|
#118
Exceptional
4.8%
Immigrants from Eastern Asia
94.0
/100
|
#119
Exceptional
4.8%
Immigrants from Southern Europe
93.4
/100
|
#120
Exceptional
4.8%
Indians (Asian)
93.2
/100
|
#121
Exceptional
4.8%

Immigrants from Indonesia Married-Couple Family Poverty Correlation Summary

MeasurementImmigrants from Indonesia DataMarried-Couple Family Poverty Data
Minimum0.025%1.0%
Maximum10.5%17.0%
Range10.5%16.0%
Mean1.8%5.2%
Median1.3%4.9%
Interquartile 25% (IQ1)0.63%3.9%
Interquartile 75% (IQ3)2.1%5.7%
Interquartile Range (IQR)1.4%1.8%
Standard Deviation (Sample)2.1%3.2%
Standard Deviation (Population)2.1%3.1%

Correlation Details

Immigrants from Indonesia PercentileSample SizeMarried-Couple Family Poverty
[
0.0%
-
0.5%
]
0.025%
113,632,6415.2%
[
0.0%
-
0.5%
]
0.075%
53,732,5225.1%
[
0.0%
-
0.5%
]
0.13%
20,681,6354.6%
[
0.0%
-
0.5%
]
0.18%
8,197,5383.9%
[
0.0%
-
0.5%
]
0.24%
6,182,3803.9%
[
0.0%
-
0.5%
]
0.29%
2,884,6004.1%
[
0.0%
-
0.5%
]
0.34%
3,225,6424.5%
[
0.0%
-
0.5%
]
0.39%
1,351,3753.7%
[
0.0%
-
0.5%
]
0.44%
983,4794.1%
[
0.5%
-
1.0%
]
0.50%
599,7333.9%
[
0.5%
-
1.0%
]
0.55%
646,6275.3%
[
0.5%
-
1.0%
]
0.60%
714,0495.8%
[
0.5%
-
1.0%
]
0.66%
462,5884.5%
[
0.5%
-
1.0%
]
0.71%
298,1274.9%
[
0.5%
-
1.0%
]
0.75%
237,8864.0%
[
0.5%
-
1.0%
]
0.81%
69,2364.0%
[
0.5%
-
1.0%
]
0.86%
193,2394.9%
[
0.5%
-
1.0%
]
0.93%
89,3454.7%
[
0.5%
-
1.0%
]
0.97%
74,0085.2%
[
1.0%
-
1.5%
]
1.04%
25,1745.6%
[
1.0%
-
1.5%
]
1.08%
18,2614.9%
[
1.0%
-
1.5%
]
1.13%
118,0266.1%
[
1.0%
-
1.5%
]
1.17%
59,7956.7%
[
1.0%
-
1.5%
]
1.24%
57,6475.2%
[
1.0%
-
1.5%
]
1.27%
12,7621.7%
[
1.0%
-
1.5%
]
1.32%
108,5346.0%
[
1.0%
-
1.5%
]
1.41%
3,1173.8%
[
1.0%
-
1.5%
]
1.46%
2,9491.1%
[
1.5%
-
2.0%
]
1.51%
1,4564.0%
[
1.5%
-
2.0%
]
1.55%
10,7605.3%
[
1.5%
-
2.0%
]
1.67%
68,32510.9%
[
1.5%
-
2.0%
]
1.69%
2,0083.9%
[
1.5%
-
2.0%
]
1.76%
54,0964.9%
[
1.5%
-
2.0%
]
1.82%
2,3681.3%
[
1.5%
-
2.0%
]
1.92%
1,3041.0%
[
2.0%
-
2.5%
]
2.02%
44,1079.3%
[
2.0%
-
2.5%
]
2.10%
2868.1%
[
2.0%
-
2.5%
]
2.18%
30,2555.2%
[
2.0%
-
2.5%
]
2.29%
6,0662.1%
[
2.0%
-
2.5%
]
2.36%
1,0581.3%
[
2.5%
-
3.0%
]
2.70%
10,6231.8%
[
2.5%
-
3.0%
]
2.82%
12,4786.5%
[
3.0%
-
3.5%
]
3.29%
23,0545.8%
[
4.0%
-
4.5%
]
4.22%
1,1382.9%
[
4.0%
-
4.5%
]
4.35%
1,0128.7%
[
4.5%
-
5.0%
]
4.57%
6345.5%
[
9.5%
-
10.0%
]
9.83%
97716.7%
[
10.5%
-
11.0%
]
10.51%
91317.0%