Immigrants from Indonesia 1 or more Vehicles in Household
COMPARE
Immigrants from Indonesia
Select to Compare
1 or more Vehicles in Household
Immigrants from Indonesia 1 or more Vehicles in Household
90.0%
1+ VEHICLES AVAILABLE
68.8/ 100
METRIC RATING
160th/ 347
METRIC RANK
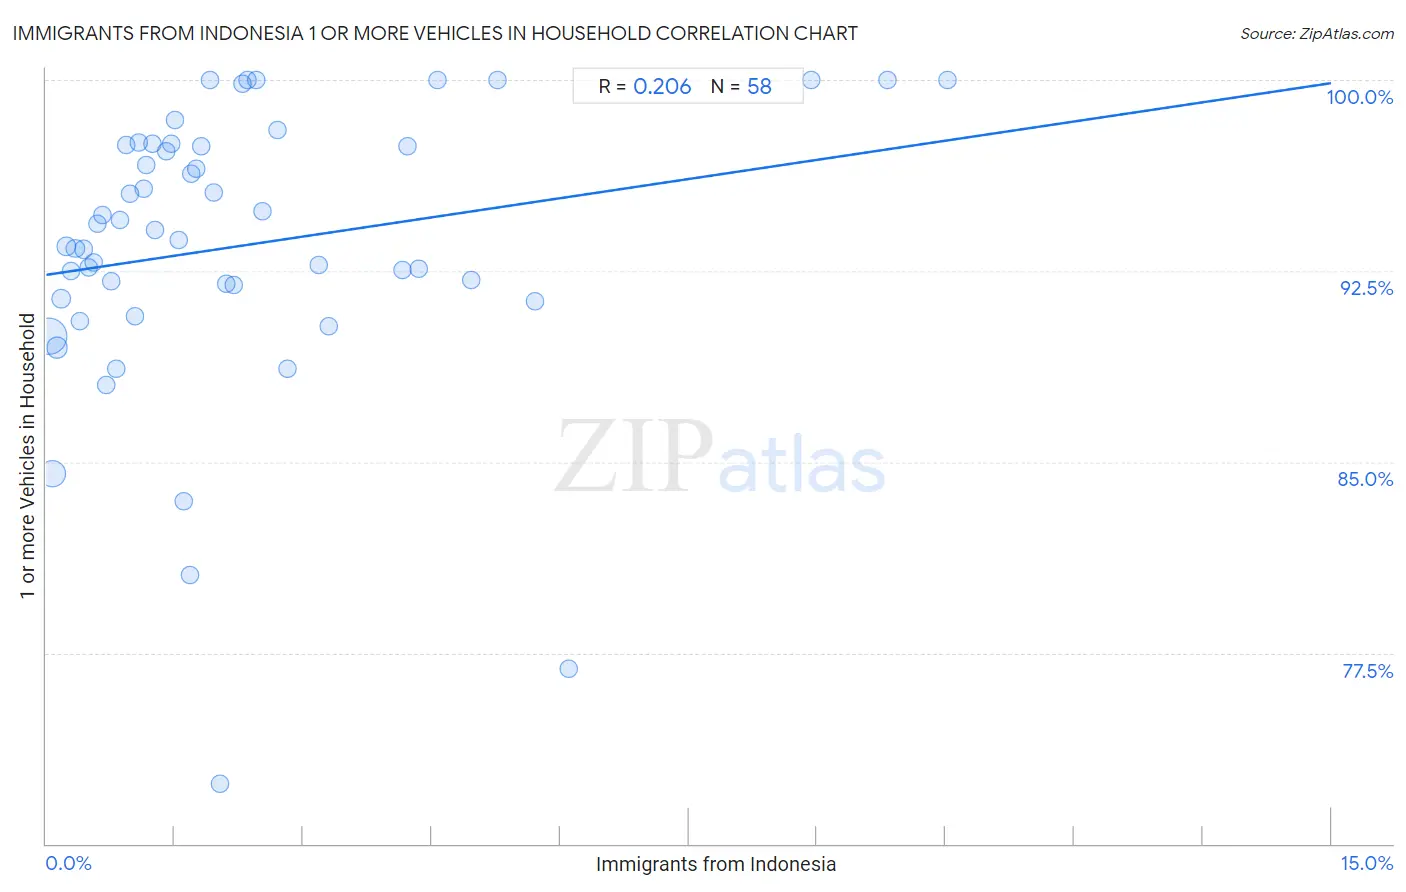
Immigrants from Indonesia 1 or more Vehicles in Household Correlation Chart
The statistical analysis conducted on geographies consisting of 215,621,131 people shows a weak positive correlation between the proportion of Immigrants from Indonesia and percentage of households with 1 or more vehicles available in the United States with a correlation coefficient (R) of 0.206 and weighted average of 90.0%. On average, for every 1% (one percent) increase in Immigrants from Indonesia within a typical geography, there is an increase of 0.50% in percentage of households with 1 or more vehicles available.
It is essential to understand that the correlation between the percentage of Immigrants from Indonesia and percentage of households with 1 or more vehicles available does not imply a direct cause-and-effect relationship. It remains uncertain whether the presence of Immigrants from Indonesia influences an upward or downward trend in the level of percentage of households with 1 or more vehicles available within an area, or if Immigrants from Indonesia simply ended up residing in those areas with higher or lower levels of percentage of households with 1 or more vehicles available due to other factors.
Demographics Similar to Immigrants from Indonesia by 1 or more Vehicles in Household
In terms of 1 or more vehicles in household, the demographic groups most similar to Immigrants from Indonesia are Salvadoran (90.0%, a difference of 0.0%), South African (90.0%, a difference of 0.020%), Spanish American Indian (89.9%, a difference of 0.030%), Immigrants from Congo (90.0%, a difference of 0.040%), and Brazilian (90.0%, a difference of 0.040%).
| Demographics | Rating | Rank | 1 or more Vehicles in Household |
| New Zealanders | 73.8 /100 | #153 | Good 90.1% |
| Immigrants from Uganda | 73.8 /100 | #154 | Good 90.1% |
| Immigrants | 73.6 /100 | #155 | Good 90.1% |
| Australians | 72.4 /100 | #156 | Good 90.0% |
| Immigrants from Congo | 71.2 /100 | #157 | Good 90.0% |
| Brazilians | 71.0 /100 | #158 | Good 90.0% |
| South Africans | 69.7 /100 | #159 | Good 90.0% |
| Immigrants from Indonesia | 68.8 /100 | #160 | Good 90.0% |
| Salvadorans | 68.7 /100 | #161 | Good 90.0% |
| Spanish American Indians | 67.0 /100 | #162 | Good 89.9% |
| Immigrants from Austria | 65.5 /100 | #163 | Good 89.9% |
| Comanche | 63.4 /100 | #164 | Good 89.9% |
| Immigrants from Saudi Arabia | 62.6 /100 | #165 | Good 89.9% |
| Immigrants from Middle Africa | 62.2 /100 | #166 | Good 89.9% |
| Immigrants from Latin America | 60.3 /100 | #167 | Good 89.8% |
Immigrants from Indonesia 1 or more Vehicles in Household Correlation Summary
| Measurement | Immigrants from Indonesia Data | 1 or more Vehicles in Household Data |
| Minimum | 0.025% | 72.3% |
| Maximum | 10.5% | 100.0% |
| Range | 10.5% | 27.7% |
| Mean | 2.3% | 93.5% |
| Median | 1.6% | 93.9% |
| Interquartile 25% (IQ1) | 0.75% | 91.4% |
| Interquartile 75% (IQ3) | 2.7% | 97.4% |
| Interquartile Range (IQR) | 1.9% | 6.0% |
| Standard Deviation (Sample) | 2.3% | 5.6% |
| Standard Deviation (Population) | 2.3% | 5.6% |
Correlation Details
| Immigrants from Indonesia Percentile | Sample Size | 1 or more Vehicles in Household |
[ 0.0% - 0.5% ] 0.025% | 113,816,663 | 90.0% |
[ 0.0% - 0.5% ] 0.075% | 53,794,494 | 84.5% |
[ 0.0% - 0.5% ] 0.13% | 20,842,632 | 89.5% |
[ 0.0% - 0.5% ] 0.18% | 8,297,452 | 91.4% |
[ 0.0% - 0.5% ] 0.24% | 6,228,782 | 93.5% |
[ 0.0% - 0.5% ] 0.29% | 2,911,790 | 92.5% |
[ 0.0% - 0.5% ] 0.34% | 3,241,833 | 93.4% |
[ 0.0% - 0.5% ] 0.39% | 1,371,621 | 90.5% |
[ 0.0% - 0.5% ] 0.44% | 1,003,421 | 93.3% |
[ 0.5% - 1.0% ] 0.50% | 623,037 | 92.6% |
[ 0.5% - 1.0% ] 0.55% | 677,470 | 92.8% |
[ 0.5% - 1.0% ] 0.60% | 724,963 | 94.3% |
[ 0.5% - 1.0% ] 0.66% | 473,086 | 94.7% |
[ 0.5% - 1.0% ] 0.71% | 311,745 | 88.0% |
[ 0.5% - 1.0% ] 0.75% | 247,842 | 92.1% |
[ 0.5% - 1.0% ] 0.81% | 78,346 | 88.7% |
[ 0.5% - 1.0% ] 0.86% | 210,643 | 94.5% |
[ 0.5% - 1.0% ] 0.93% | 90,850 | 97.4% |
[ 0.5% - 1.0% ] 0.97% | 75,843 | 95.5% |
[ 1.0% - 1.5% ] 1.04% | 25,174 | 90.7% |
[ 1.0% - 1.5% ] 1.08% | 19,188 | 97.5% |
[ 1.0% - 1.5% ] 1.13% | 122,247 | 95.7% |
[ 1.0% - 1.5% ] 1.17% | 59,795 | 96.7% |
[ 1.0% - 1.5% ] 1.24% | 57,812 | 97.5% |
[ 1.0% - 1.5% ] 1.27% | 12,762 | 94.1% |
[ 1.0% - 1.5% ] 1.40% | 4,496 | 97.2% |
[ 1.0% - 1.5% ] 1.46% | 2,949 | 97.5% |
[ 1.5% - 2.0% ] 1.50% | 2,860 | 98.4% |
[ 1.5% - 2.0% ] 1.55% | 12,166 | 93.7% |
[ 1.5% - 2.0% ] 1.61% | 4,718 | 83.4% |
[ 1.5% - 2.0% ] 1.67% | 68,325 | 80.6% |
[ 1.5% - 2.0% ] 1.69% | 2,538 | 96.3% |
[ 1.5% - 2.0% ] 1.76% | 55,333 | 96.5% |
[ 1.5% - 2.0% ] 1.82% | 2,368 | 97.4% |
[ 1.5% - 2.0% ] 1.92% | 1,462 | 100.0% |
[ 1.5% - 2.0% ] 1.95% | 205 | 95.6% |
[ 2.0% - 2.5% ] 2.02% | 44,107 | 72.3% |
[ 2.0% - 2.5% ] 2.10% | 286 | 92.0% |
[ 2.0% - 2.5% ] 2.18% | 30,255 | 91.9% |
[ 2.0% - 2.5% ] 2.29% | 6,154 | 99.8% |
[ 2.0% - 2.5% ] 2.35% | 1,746 | 100.0% |
[ 2.0% - 2.5% ] 2.46% | 4,150 | 100.0% |
[ 2.5% - 3.0% ] 2.52% | 1,983 | 94.9% |
[ 2.5% - 3.0% ] 2.70% | 10,918 | 98.1% |
[ 2.5% - 3.0% ] 2.82% | 12,478 | 88.7% |
[ 3.0% - 3.5% ] 3.18% | 472 | 92.7% |
[ 3.0% - 3.5% ] 3.29% | 23,054 | 90.3% |
[ 4.0% - 4.5% ] 4.16% | 985 | 92.5% |
[ 4.0% - 4.5% ] 4.22% | 1,138 | 97.4% |
[ 4.0% - 4.5% ] 4.35% | 1,012 | 92.6% |
[ 4.5% - 5.0% ] 4.57% | 634 | 100.0% |
[ 4.5% - 5.0% ] 4.95% | 222 | 92.2% |
[ 5.0% - 5.5% ] 5.26% | 171 | 100.0% |
[ 5.5% - 6.0% ] 5.70% | 193 | 91.3% |
[ 6.0% - 6.5% ] 6.10% | 738 | 76.9% |
[ 8.5% - 9.0% ] 8.94% | 1,634 | 100.0% |
[ 9.5% - 10.0% ] 9.83% | 977 | 100.0% |
[ 10.5% - 11.0% ] 10.51% | 913 | 100.0% |