Immigrants from Indonesia Disability Age Under 5
COMPARE
Immigrants from Indonesia
Select to Compare
Disability Age Under 5
Immigrants from Indonesia Disability Age Under 5
1.1%
DISABILITY | AGE UNDER 5
98.7/ 100
METRIC RATING
66th/ 347
METRIC RANK
Immigrants from Indonesia Disability Age Under 5 Correlation Chart
The statistical analysis conducted on geographies consisting of 141,877,475 people shows a very strong positive correlation between the proportion of Immigrants from Indonesia and percentage of population with a disability under the age of 5 in the United States with a correlation coefficient (R) of 0.896 and weighted average of 1.1%. On average, for every 1% (one percent) increase in Immigrants from Indonesia within a typical geography, there is an increase of 7.3% in percentage of population with a disability under the age of 5.
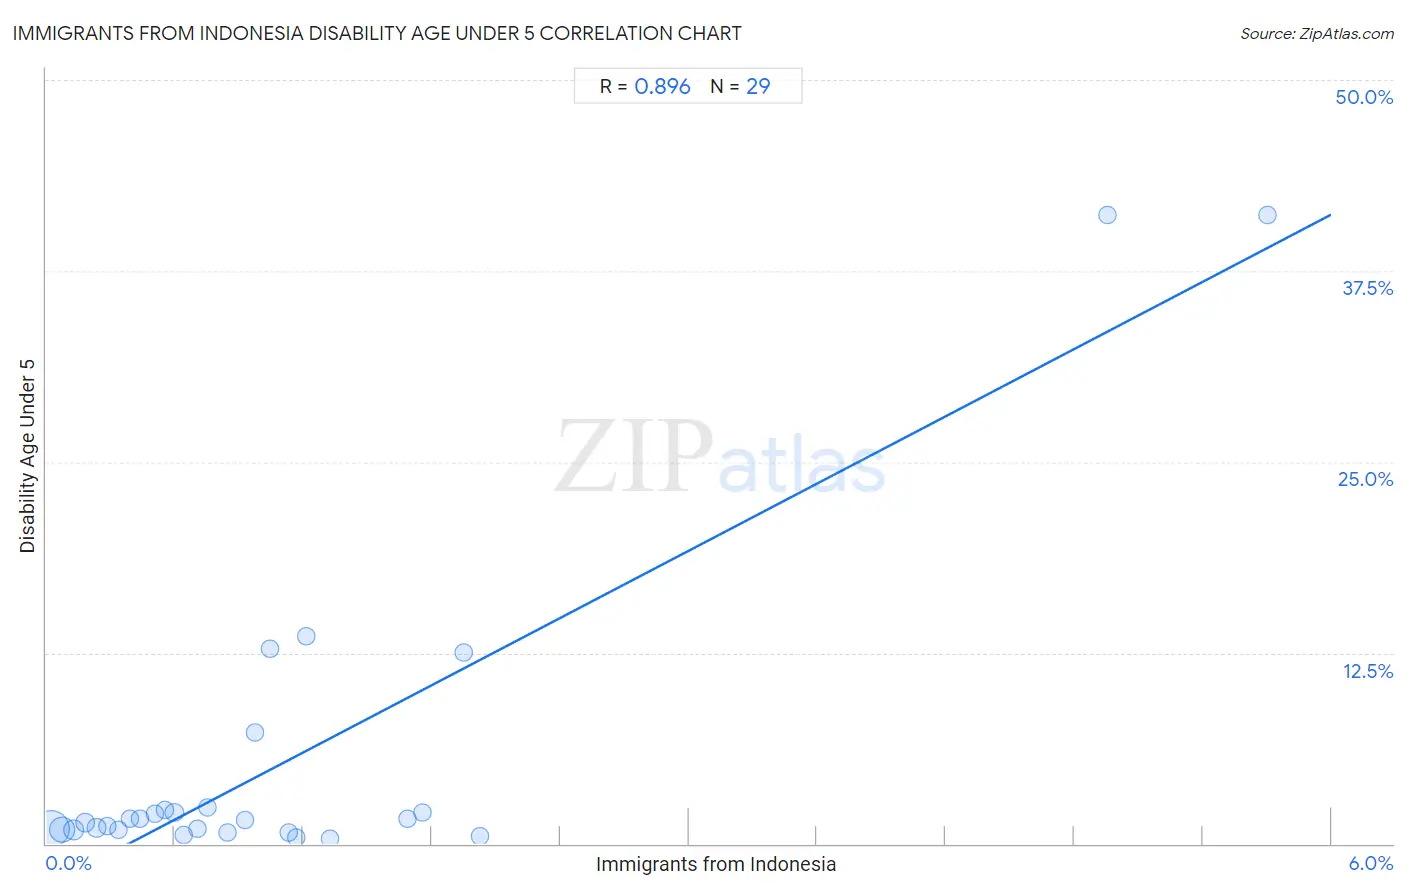
It is essential to understand that the correlation between the percentage of Immigrants from Indonesia and percentage of population with a disability under the age of 5 does not imply a direct cause-and-effect relationship. It remains uncertain whether the presence of Immigrants from Indonesia influences an upward or downward trend in the level of percentage of population with a disability under the age of 5 within an area, or if Immigrants from Indonesia simply ended up residing in those areas with higher or lower levels of percentage of population with a disability under the age of 5 due to other factors.
Demographics Similar to Immigrants from Indonesia by Disability Age Under 5
In terms of disability age under 5, the demographic groups most similar to Immigrants from Indonesia are Immigrants from Belize (1.1%, a difference of 0.070%), South African (1.1%, a difference of 0.10%), Immigrants from Korea (1.1%, a difference of 0.13%), Israeli (1.1%, a difference of 0.13%), and Immigrants from Ecuador (1.1%, a difference of 0.22%).
| Demographics | Rating | Rank | Disability Age Under 5 |
| Immigrants from Malaysia | 99.4 /100 | #59 | Exceptional 1.1% |
| Immigrants from Western Asia | 99.2 /100 | #60 | Exceptional 1.1% |
| Immigrants from Ethiopia | 99.2 /100 | #61 | Exceptional 1.1% |
| Immigrants from Switzerland | 99.2 /100 | #62 | Exceptional 1.1% |
| Immigrants from Vietnam | 99.1 /100 | #63 | Exceptional 1.1% |
| Egyptians | 98.9 /100 | #64 | Exceptional 1.1% |
| Immigrants from Korea | 98.8 /100 | #65 | Exceptional 1.1% |
| Immigrants from Indonesia | 98.7 /100 | #66 | Exceptional 1.1% |
| Immigrants from Belize | 98.7 /100 | #67 | Exceptional 1.1% |
| South Africans | 98.7 /100 | #68 | Exceptional 1.1% |
| Israelis | 98.7 /100 | #69 | Exceptional 1.1% |
| Immigrants from Ecuador | 98.6 /100 | #70 | Exceptional 1.1% |
| Trinidadians and Tobagonians | 98.6 /100 | #71 | Exceptional 1.1% |
| Burmese | 98.5 /100 | #72 | Exceptional 1.1% |
| Immigrants from Sri Lanka | 98.5 /100 | #73 | Exceptional 1.1% |
Immigrants from Indonesia Disability Age Under 5 Correlation Summary
| Measurement | Immigrants from Indonesia Data | Disability Age Under 5 Data |
| Minimum | 0.023% | 0.33% |
| Maximum | 5.7% | 41.2% |
| Range | 5.7% | 40.8% |
| Mean | 1.1% | 5.4% |
| Median | 0.75% | 1.5% |
| Interquartile 25% (IQ1) | 0.36% | 0.90% |
| Interquartile 75% (IQ3) | 1.3% | 2.3% |
| Interquartile Range (IQR) | 0.90% | 1.4% |
| Standard Deviation (Sample) | 1.3% | 10.6% |
| Standard Deviation (Population) | 1.3% | 10.4% |
Correlation Details
| Immigrants from Indonesia Percentile | Sample Size | Disability Age Under 5 |
[ 0.0% - 0.5% ] 0.023% | 81,609,441 | 0.94% |
[ 0.0% - 0.5% ] 0.075% | 35,763,579 | 0.91% |
[ 0.0% - 0.5% ] 0.13% | 11,474,102 | 0.91% |
[ 0.0% - 0.5% ] 0.18% | 4,270,600 | 1.4% |
[ 0.0% - 0.5% ] 0.23% | 2,836,501 | 1.0% |
[ 0.0% - 0.5% ] 0.29% | 1,504,754 | 1.2% |
[ 0.0% - 0.5% ] 0.34% | 1,899,588 | 0.89% |
[ 0.0% - 0.5% ] 0.39% | 363,900 | 1.7% |
[ 0.0% - 0.5% ] 0.44% | 369,293 | 1.7% |
[ 0.5% - 1.0% ] 0.51% | 118,097 | 2.0% |
[ 0.5% - 1.0% ] 0.55% | 392,464 | 2.2% |
[ 0.5% - 1.0% ] 0.60% | 351,378 | 2.0% |
[ 0.5% - 1.0% ] 0.64% | 128,200 | 0.59% |
[ 0.5% - 1.0% ] 0.71% | 187,763 | 0.96% |
[ 0.5% - 1.0% ] 0.75% | 73,361 | 2.4% |
[ 0.5% - 1.0% ] 0.85% | 71,040 | 0.72% |
[ 0.5% - 1.0% ] 0.93% | 73,105 | 1.5% |
[ 0.5% - 1.0% ] 0.98% | 16,183 | 7.2% |
[ 1.0% - 1.5% ] 1.05% | 11,376 | 12.7% |
[ 1.0% - 1.5% ] 1.13% | 93,857 | 0.76% |
[ 1.0% - 1.5% ] 1.17% | 43,851 | 0.39% |
[ 1.0% - 1.5% ] 1.21% | 22,654 | 13.6% |
[ 1.0% - 1.5% ] 1.32% | 102,618 | 0.33% |
[ 1.5% - 2.0% ] 1.69% | 947 | 1.7% |
[ 1.5% - 2.0% ] 1.76% | 54,096 | 2.0% |
[ 1.5% - 2.0% ] 1.95% | 205 | 12.5% |
[ 2.0% - 2.5% ] 2.02% | 44,107 | 0.46% |
[ 4.5% - 5.0% ] 4.95% | 222 | 41.2% |
[ 5.5% - 6.0% ] 5.70% | 193 | 41.2% |