Immigrants from Hong Kong Disability Age 18 to 34
COMPARE
Immigrants from Hong Kong
Select to Compare
Disability Age 18 to 34
Immigrants from Hong Kong Disability Age 18 to 34
5.2%
DISABILITY | AGE 18 TO 34
100.0/ 100
METRIC RATING
2nd/ 347
METRIC RANK
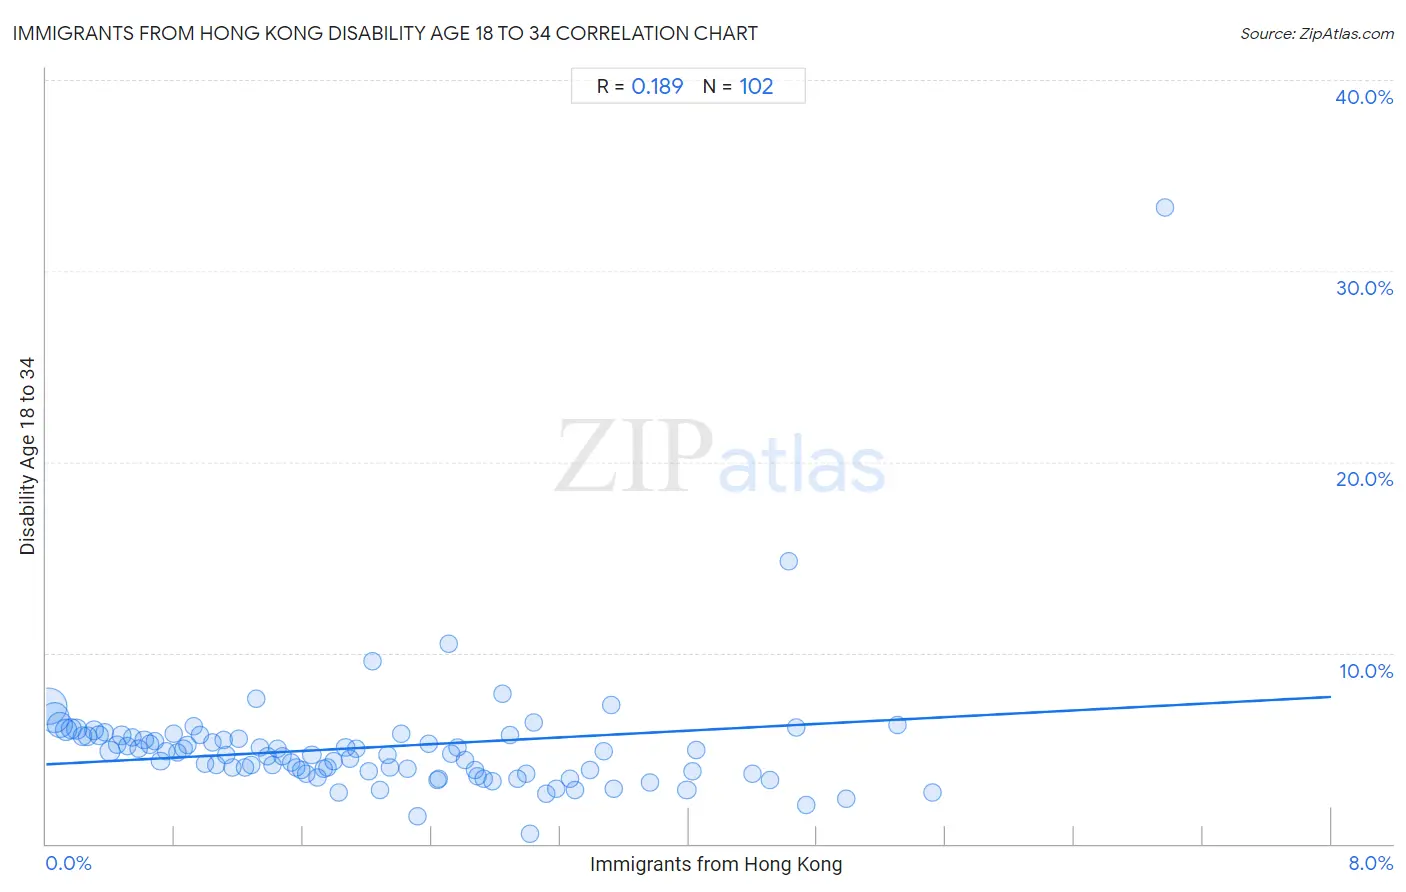
Immigrants from Hong Kong Disability Age 18 to 34 Correlation Chart
The statistical analysis conducted on geographies consisting of 253,676,267 people shows a poor positive correlation between the proportion of Immigrants from Hong Kong and percentage of population with a disability between the ages 18 and 35 in the United States with a correlation coefficient (R) of 0.189 and weighted average of 5.2%. On average, for every 1% (one percent) increase in Immigrants from Hong Kong within a typical geography, there is an increase of 0.44% in percentage of population with a disability between the ages 18 and 35.
It is essential to understand that the correlation between the percentage of Immigrants from Hong Kong and percentage of population with a disability between the ages 18 and 35 does not imply a direct cause-and-effect relationship. It remains uncertain whether the presence of Immigrants from Hong Kong influences an upward or downward trend in the level of percentage of population with a disability between the ages 18 and 35 within an area, or if Immigrants from Hong Kong simply ended up residing in those areas with higher or lower levels of percentage of population with a disability between the ages 18 and 35 due to other factors.
Demographics Similar to Immigrants from Hong Kong by Disability Age 18 to 34
In terms of disability age 18 to 34, the demographic groups most similar to Immigrants from Hong Kong are Immigrants from Grenada (5.3%, a difference of 2.2%), Immigrants from Cuba (5.4%, a difference of 2.8%), Immigrants from Taiwan (5.4%, a difference of 3.1%), Immigrants from Armenia (5.0%, a difference of 4.3%), and Filipino (5.4%, a difference of 4.4%).
| Demographics | Rating | Rank | Disability Age 18 to 34 |
| Immigrants from Armenia | 100.0 /100 | #1 | Exceptional 5.0% |
| Immigrants from Hong Kong | 100.0 /100 | #2 | Exceptional 5.2% |
| Immigrants from Grenada | 100.0 /100 | #3 | Exceptional 5.3% |
| Immigrants from Cuba | 100.0 /100 | #4 | Exceptional 5.4% |
| Immigrants from Taiwan | 100.0 /100 | #5 | Exceptional 5.4% |
| Filipinos | 100.0 /100 | #6 | Exceptional 5.4% |
| Immigrants from China | 100.0 /100 | #7 | Exceptional 5.4% |
| Immigrants from Guyana | 100.0 /100 | #8 | Exceptional 5.5% |
| Guyanese | 100.0 /100 | #9 | Exceptional 5.5% |
| Immigrants from Uzbekistan | 100.0 /100 | #10 | Exceptional 5.5% |
| Vietnamese | 100.0 /100 | #11 | Exceptional 5.5% |
| Immigrants from St. Vincent and the Grenadines | 100.0 /100 | #12 | Exceptional 5.5% |
| Immigrants from Iran | 100.0 /100 | #13 | Exceptional 5.5% |
| Indians (Asian) | 100.0 /100 | #14 | Exceptional 5.5% |
| Immigrants from India | 100.0 /100 | #15 | Exceptional 5.6% |
Immigrants from Hong Kong Disability Age 18 to 34 Correlation Summary
| Measurement | Immigrants from Hong Kong Data | Disability Age 18 to 34 Data |
| Minimum | 0.018% | 0.51% |
| Maximum | 7.0% | 33.3% |
| Range | 6.9% | 32.8% |
| Mean | 2.0% | 5.0% |
| Median | 1.8% | 4.7% |
| Interquartile 25% (IQ1) | 0.88% | 3.8% |
| Interquartile 75% (IQ3) | 2.9% | 5.6% |
| Interquartile Range (IQR) | 2.0% | 1.9% |
| Standard Deviation (Sample) | 1.4% | 3.4% |
| Standard Deviation (Population) | 1.4% | 3.3% |
Correlation Details
| Immigrants from Hong Kong Percentile | Sample Size | Disability Age 18 to 34 |
[ 0.0% - 0.5% ] 0.018% | 79,870,770 | 7.2% |
[ 0.0% - 0.5% ] 0.051% | 52,290,352 | 6.6% |
[ 0.0% - 0.5% ] 0.088% | 32,778,498 | 6.2% |
[ 0.0% - 0.5% ] 0.12% | 17,355,606 | 6.0% |
[ 0.0% - 0.5% ] 0.16% | 10,554,803 | 6.0% |
[ 0.0% - 0.5% ] 0.19% | 7,278,385 | 6.0% |
[ 0.0% - 0.5% ] 0.23% | 6,042,036 | 5.6% |
[ 0.0% - 0.5% ] 0.26% | 5,133,896 | 5.6% |
[ 0.0% - 0.5% ] 0.30% | 2,950,036 | 5.9% |
[ 0.0% - 0.5% ] 0.33% | 3,636,568 | 5.7% |
[ 0.0% - 0.5% ] 0.37% | 1,977,836 | 5.8% |
[ 0.0% - 0.5% ] 0.40% | 10,433,486 | 4.8% |
[ 0.0% - 0.5% ] 0.44% | 3,020,758 | 5.2% |
[ 0.0% - 0.5% ] 0.47% | 2,175,091 | 5.7% |
[ 0.5% - 1.0% ] 0.50% | 1,340,732 | 5.1% |
[ 0.5% - 1.0% ] 0.54% | 913,241 | 5.6% |
[ 0.5% - 1.0% ] 0.57% | 972,318 | 5.0% |
[ 0.5% - 1.0% ] 0.61% | 1,198,827 | 5.5% |
[ 0.5% - 1.0% ] 0.65% | 1,078,692 | 5.2% |
[ 0.5% - 1.0% ] 0.68% | 741,865 | 5.4% |
[ 0.5% - 1.0% ] 0.71% | 595,764 | 4.3% |
[ 0.5% - 1.0% ] 0.75% | 287,240 | 4.9% |
[ 0.5% - 1.0% ] 0.79% | 734,561 | 5.7% |
[ 0.5% - 1.0% ] 0.82% | 465,973 | 4.8% |
[ 0.5% - 1.0% ] 0.86% | 433,448 | 5.0% |
[ 0.5% - 1.0% ] 0.88% | 367,951 | 5.2% |
[ 0.5% - 1.0% ] 0.91% | 189,057 | 6.2% |
[ 0.5% - 1.0% ] 0.96% | 250,336 | 5.7% |
[ 0.5% - 1.0% ] 0.99% | 302,609 | 4.2% |
[ 1.0% - 1.5% ] 1.03% | 414,695 | 5.3% |
[ 1.0% - 1.5% ] 1.06% | 216,812 | 4.1% |
[ 1.0% - 1.5% ] 1.10% | 601,319 | 5.5% |
[ 1.0% - 1.5% ] 1.12% | 115,218 | 4.6% |
[ 1.0% - 1.5% ] 1.16% | 267,257 | 4.0% |
[ 1.0% - 1.5% ] 1.20% | 305,799 | 5.5% |
[ 1.0% - 1.5% ] 1.23% | 291,361 | 4.0% |
[ 1.0% - 1.5% ] 1.28% | 455,873 | 4.2% |
[ 1.0% - 1.5% ] 1.31% | 106,135 | 7.6% |
[ 1.0% - 1.5% ] 1.33% | 120,781 | 5.0% |
[ 1.0% - 1.5% ] 1.38% | 217,322 | 4.6% |
[ 1.0% - 1.5% ] 1.41% | 213,769 | 4.1% |
[ 1.0% - 1.5% ] 1.44% | 165,074 | 5.0% |
[ 1.0% - 1.5% ] 1.47% | 89,020 | 4.6% |
[ 1.5% - 2.0% ] 1.53% | 188,777 | 4.2% |
[ 1.5% - 2.0% ] 1.55% | 195,259 | 4.0% |
[ 1.5% - 2.0% ] 1.59% | 104,589 | 3.9% |
[ 1.5% - 2.0% ] 1.62% | 103,875 | 3.7% |
[ 1.5% - 2.0% ] 1.65% | 142,957 | 4.6% |
[ 1.5% - 2.0% ] 1.69% | 212,390 | 3.5% |
[ 1.5% - 2.0% ] 1.73% | 69,708 | 3.9% |
[ 1.5% - 2.0% ] 1.75% | 198,364 | 4.0% |
[ 1.5% - 2.0% ] 1.79% | 933,319 | 4.3% |
[ 1.5% - 2.0% ] 1.82% | 132,977 | 2.7% |
[ 1.5% - 2.0% ] 1.86% | 194,065 | 5.0% |
[ 1.5% - 2.0% ] 1.89% | 199,304 | 4.5% |
[ 1.5% - 2.0% ] 1.93% | 58,705 | 5.0% |
[ 2.0% - 2.5% ] 2.01% | 61,312 | 3.8% |
[ 2.0% - 2.5% ] 2.03% | 4,336 | 9.5% |
[ 2.0% - 2.5% ] 2.08% | 67,785 | 2.8% |
[ 2.0% - 2.5% ] 2.12% | 66,262 | 4.6% |
[ 2.0% - 2.5% ] 2.14% | 104,605 | 4.0% |
[ 2.0% - 2.5% ] 2.21% | 634 | 5.7% |
[ 2.0% - 2.5% ] 2.25% | 195,750 | 3.9% |
[ 2.0% - 2.5% ] 2.31% | 10,205 | 1.4% |
[ 2.0% - 2.5% ] 2.38% | 121,317 | 5.2% |
[ 2.0% - 2.5% ] 2.43% | 39,211 | 3.3% |
[ 2.0% - 2.5% ] 2.45% | 43,851 | 3.4% |
[ 2.5% - 3.0% ] 2.51% | 6,145 | 10.5% |
[ 2.5% - 3.0% ] 2.52% | 79,195 | 4.7% |
[ 2.5% - 3.0% ] 2.56% | 20,272 | 5.0% |
[ 2.5% - 3.0% ] 2.61% | 66,979 | 4.4% |
[ 2.5% - 3.0% ] 2.67% | 42,916 | 3.9% |
[ 2.5% - 3.0% ] 2.68% | 65,125 | 3.6% |
[ 2.5% - 3.0% ] 2.73% | 13,722 | 3.4% |
[ 2.5% - 3.0% ] 2.78% | 31,447 | 3.3% |
[ 2.5% - 3.0% ] 2.84% | 2,079 | 7.8% |
[ 2.5% - 3.0% ] 2.89% | 19,928 | 5.7% |
[ 2.5% - 3.0% ] 2.94% | 239,314 | 3.4% |
[ 2.5% - 3.0% ] 2.99% | 21,738 | 3.7% |
[ 3.0% - 3.5% ] 3.01% | 18,426 | 0.51% |
[ 3.0% - 3.5% ] 3.03% | 56,181 | 6.4% |
[ 3.0% - 3.5% ] 3.12% | 2,825 | 2.6% |
[ 3.0% - 3.5% ] 3.17% | 46,331 | 2.9% |
[ 3.0% - 3.5% ] 3.26% | 55,863 | 3.4% |
[ 3.0% - 3.5% ] 3.30% | 12,442 | 2.8% |
[ 3.0% - 3.5% ] 3.39% | 40,738 | 3.9% |
[ 3.0% - 3.5% ] 3.47% | 27,641 | 4.8% |
[ 3.5% - 4.0% ] 3.52% | 33,367 | 7.2% |
[ 3.5% - 4.0% ] 3.53% | 29,006 | 2.9% |
[ 3.5% - 4.0% ] 3.76% | 4,419 | 3.2% |
[ 3.5% - 4.0% ] 3.99% | 86,804 | 2.8% |
[ 4.0% - 4.5% ] 4.02% | 58,106 | 3.8% |
[ 4.0% - 4.5% ] 4.05% | 22,654 | 4.9% |
[ 4.0% - 4.5% ] 4.39% | 43,903 | 3.6% |
[ 4.5% - 5.0% ] 4.50% | 59,453 | 3.4% |
[ 4.5% - 5.0% ] 4.62% | 909 | 14.8% |
[ 4.5% - 5.0% ] 4.67% | 321 | 6.1% |
[ 4.5% - 5.0% ] 4.73% | 14,225 | 2.0% |
[ 4.5% - 5.0% ] 4.98% | 45,650 | 2.4% |
[ 5.0% - 5.5% ] 5.30% | 283 | 6.2% |
[ 5.5% - 6.0% ] 5.52% | 6,975 | 2.7% |
[ 6.5% - 7.0% ] 6.96% | 158 | 33.3% |