Immigrants from Hong Kong Self-Care Disability
COMPARE
Immigrants from Hong Kong
Select to Compare
Self-Care Disability
Immigrants from Hong Kong Self-Care Disability
2.4%
SELF-CARE DISABILITY
93.1/ 100
METRIC RATING
115th/ 347
METRIC RANK
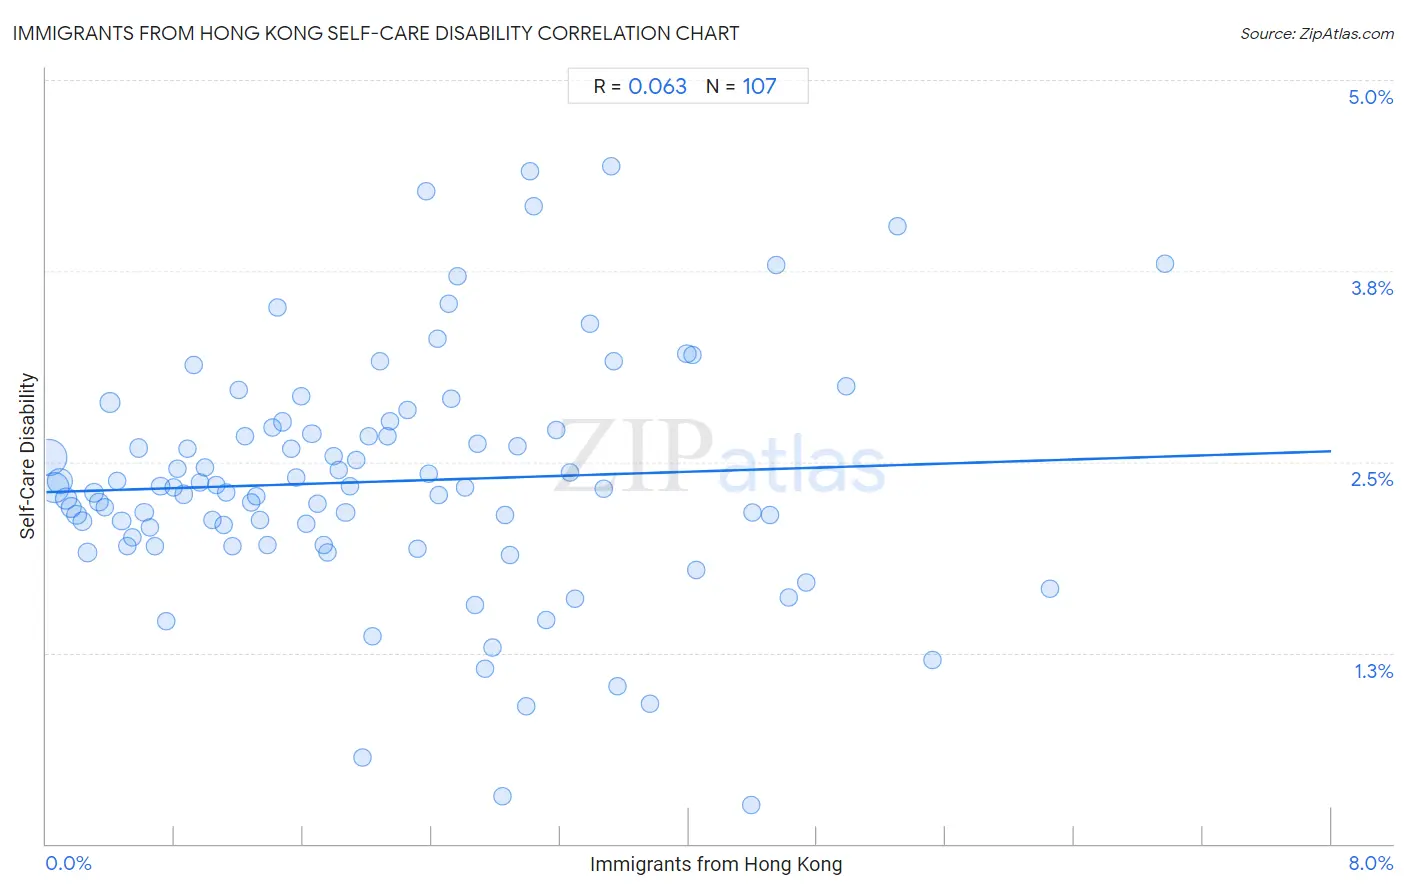
Immigrants from Hong Kong Self-Care Disability Correlation Chart
The statistical analysis conducted on geographies consisting of 253,791,593 people shows a slight positive correlation between the proportion of Immigrants from Hong Kong and percentage of population with self-care disability in the United States with a correlation coefficient (R) of 0.063 and weighted average of 2.4%. On average, for every 1% (one percent) increase in Immigrants from Hong Kong within a typical geography, there is an increase of 0.034% in percentage of population with self-care disability.
It is essential to understand that the correlation between the percentage of Immigrants from Hong Kong and percentage of population with self-care disability does not imply a direct cause-and-effect relationship. It remains uncertain whether the presence of Immigrants from Hong Kong influences an upward or downward trend in the level of percentage of population with self-care disability within an area, or if Immigrants from Hong Kong simply ended up residing in those areas with higher or lower levels of percentage of population with self-care disability due to other factors.
Demographics Similar to Immigrants from Hong Kong by Self-Care Disability
In terms of self-care disability, the demographic groups most similar to Immigrants from Hong Kong are Immigrants from North Macedonia (2.4%, a difference of 0.0%), South American (2.4%, a difference of 0.010%), Northern European (2.4%, a difference of 0.050%), Scandinavian (2.4%, a difference of 0.070%), and Serbian (2.4%, a difference of 0.090%).
| Demographics | Rating | Rank | Self-Care Disability |
| Greeks | 94.1 /100 | #108 | Exceptional 2.4% |
| Slovenes | 94.1 /100 | #109 | Exceptional 2.4% |
| Immigrants from Africa | 93.7 /100 | #110 | Exceptional 2.4% |
| Serbians | 93.6 /100 | #111 | Exceptional 2.4% |
| Scandinavians | 93.5 /100 | #112 | Exceptional 2.4% |
| South Americans | 93.2 /100 | #113 | Exceptional 2.4% |
| Immigrants from North Macedonia | 93.1 /100 | #114 | Exceptional 2.4% |
| Immigrants from Hong Kong | 93.1 /100 | #115 | Exceptional 2.4% |
| Northern Europeans | 92.9 /100 | #116 | Exceptional 2.4% |
| Taiwanese | 92.5 /100 | #117 | Exceptional 2.4% |
| Immigrants from Canada | 92.0 /100 | #118 | Exceptional 2.4% |
| Immigrants from Sierra Leone | 91.8 /100 | #119 | Exceptional 2.4% |
| Uruguayans | 91.5 /100 | #120 | Exceptional 2.4% |
| Peruvians | 91.3 /100 | #121 | Exceptional 2.4% |
| Belgians | 90.9 /100 | #122 | Exceptional 2.4% |
Immigrants from Hong Kong Self-Care Disability Correlation Summary
| Measurement | Immigrants from Hong Kong Data | Self-Care Disability Data |
| Minimum | 0.018% | 0.25% |
| Maximum | 7.0% | 4.4% |
| Range | 6.9% | 4.2% |
| Mean | 2.1% | 2.4% |
| Median | 1.9% | 2.3% |
| Interquartile 25% (IQ1) | 0.91% | 2.0% |
| Interquartile 75% (IQ3) | 3.0% | 2.7% |
| Interquartile Range (IQR) | 2.1% | 0.75% |
| Standard Deviation (Sample) | 1.5% | 0.79% |
| Standard Deviation (Population) | 1.5% | 0.78% |
Correlation Details
| Immigrants from Hong Kong Percentile | Sample Size | Self-Care Disability |
[ 0.0% - 0.5% ] 0.018% | 79,880,814 | 2.5% |
[ 0.0% - 0.5% ] 0.051% | 52,262,473 | 2.3% |
[ 0.0% - 0.5% ] 0.088% | 32,755,187 | 2.4% |
[ 0.0% - 0.5% ] 0.12% | 17,353,236 | 2.3% |
[ 0.0% - 0.5% ] 0.16% | 10,559,714 | 2.2% |
[ 0.0% - 0.5% ] 0.19% | 7,275,846 | 2.2% |
[ 0.0% - 0.5% ] 0.23% | 6,038,854 | 2.1% |
[ 0.0% - 0.5% ] 0.26% | 5,152,925 | 1.9% |
[ 0.0% - 0.5% ] 0.30% | 2,956,832 | 2.3% |
[ 0.0% - 0.5% ] 0.33% | 3,650,408 | 2.2% |
[ 0.0% - 0.5% ] 0.37% | 1,979,755 | 2.2% |
[ 0.0% - 0.5% ] 0.40% | 10,465,848 | 2.9% |
[ 0.0% - 0.5% ] 0.44% | 3,020,276 | 2.4% |
[ 0.0% - 0.5% ] 0.47% | 2,179,495 | 2.1% |
[ 0.5% - 1.0% ] 0.50% | 1,380,285 | 1.9% |
[ 0.5% - 1.0% ] 0.54% | 915,839 | 2.0% |
[ 0.5% - 1.0% ] 0.57% | 974,774 | 2.6% |
[ 0.5% - 1.0% ] 0.61% | 1,201,129 | 2.2% |
[ 0.5% - 1.0% ] 0.65% | 1,079,936 | 2.1% |
[ 0.5% - 1.0% ] 0.68% | 736,496 | 1.9% |
[ 0.5% - 1.0% ] 0.71% | 594,228 | 2.3% |
[ 0.5% - 1.0% ] 0.75% | 287,240 | 1.5% |
[ 0.5% - 1.0% ] 0.79% | 740,407 | 2.3% |
[ 0.5% - 1.0% ] 0.82% | 468,907 | 2.5% |
[ 0.5% - 1.0% ] 0.86% | 440,810 | 2.3% |
[ 0.5% - 1.0% ] 0.88% | 367,951 | 2.6% |
[ 0.5% - 1.0% ] 0.91% | 191,191 | 3.1% |
[ 0.5% - 1.0% ] 0.96% | 250,748 | 2.4% |
[ 0.5% - 1.0% ] 0.99% | 299,300 | 2.5% |
[ 1.0% - 1.5% ] 1.03% | 409,945 | 2.1% |
[ 1.0% - 1.5% ] 1.06% | 217,562 | 2.4% |
[ 1.0% - 1.5% ] 1.10% | 601,687 | 2.1% |
[ 1.0% - 1.5% ] 1.12% | 115,218 | 2.3% |
[ 1.0% - 1.5% ] 1.16% | 269,374 | 1.9% |
[ 1.0% - 1.5% ] 1.20% | 309,785 | 3.0% |
[ 1.0% - 1.5% ] 1.23% | 292,806 | 2.7% |
[ 1.0% - 1.5% ] 1.28% | 455,873 | 2.2% |
[ 1.0% - 1.5% ] 1.31% | 111,763 | 2.3% |
[ 1.0% - 1.5% ] 1.33% | 123,011 | 2.1% |
[ 1.0% - 1.5% ] 1.38% | 217,322 | 2.0% |
[ 1.0% - 1.5% ] 1.41% | 213,981 | 2.7% |
[ 1.0% - 1.5% ] 1.44% | 165,074 | 3.5% |
[ 1.0% - 1.5% ] 1.47% | 89,020 | 2.8% |
[ 1.5% - 2.0% ] 1.53% | 180,375 | 2.6% |
[ 1.5% - 2.0% ] 1.55% | 195,259 | 2.4% |
[ 1.5% - 2.0% ] 1.59% | 104,589 | 2.9% |
[ 1.5% - 2.0% ] 1.62% | 103,875 | 2.1% |
[ 1.5% - 2.0% ] 1.65% | 144,103 | 2.7% |
[ 1.5% - 2.0% ] 1.69% | 212,390 | 2.2% |
[ 1.5% - 2.0% ] 1.73% | 69,708 | 2.0% |
[ 1.5% - 2.0% ] 1.75% | 198,364 | 1.9% |
[ 1.5% - 2.0% ] 1.79% | 931,650 | 2.5% |
[ 1.5% - 2.0% ] 1.82% | 131,115 | 2.4% |
[ 1.5% - 2.0% ] 1.86% | 194,065 | 2.2% |
[ 1.5% - 2.0% ] 1.89% | 199,304 | 2.3% |
[ 1.5% - 2.0% ] 1.93% | 58,705 | 2.5% |
[ 1.5% - 2.0% ] 1.97% | 6,238 | 0.57% |
[ 2.0% - 2.5% ] 2.01% | 61,312 | 2.7% |
[ 2.0% - 2.5% ] 2.03% | 4,336 | 1.4% |
[ 2.0% - 2.5% ] 2.08% | 67,785 | 3.2% |
[ 2.0% - 2.5% ] 2.12% | 70,245 | 2.7% |
[ 2.0% - 2.5% ] 2.14% | 104,605 | 2.8% |
[ 2.0% - 2.5% ] 2.25% | 195,750 | 2.8% |
[ 2.0% - 2.5% ] 2.31% | 10,205 | 1.9% |
[ 2.0% - 2.5% ] 2.37% | 169 | 4.3% |
[ 2.0% - 2.5% ] 2.38% | 121,317 | 2.4% |
[ 2.0% - 2.5% ] 2.43% | 40,451 | 3.3% |
[ 2.0% - 2.5% ] 2.45% | 43,851 | 2.3% |
[ 2.5% - 3.0% ] 2.51% | 6,145 | 3.5% |
[ 2.5% - 3.0% ] 2.52% | 79,195 | 2.9% |
[ 2.5% - 3.0% ] 2.56% | 20,272 | 3.7% |
[ 2.5% - 3.0% ] 2.61% | 66,979 | 2.3% |
[ 2.5% - 3.0% ] 2.67% | 43,141 | 1.6% |
[ 2.5% - 3.0% ] 2.68% | 65,125 | 2.6% |
[ 2.5% - 3.0% ] 2.73% | 24,344 | 1.1% |
[ 2.5% - 3.0% ] 2.78% | 31,447 | 1.3% |
[ 2.5% - 3.0% ] 2.84% | 2,079 | 0.31% |
[ 2.5% - 3.0% ] 2.86% | 525 | 2.2% |
[ 2.5% - 3.0% ] 2.89% | 19,928 | 1.9% |
[ 2.5% - 3.0% ] 2.94% | 239,314 | 2.6% |
[ 2.5% - 3.0% ] 2.99% | 21,738 | 0.90% |
[ 3.0% - 3.5% ] 3.01% | 18,426 | 4.4% |
[ 3.0% - 3.5% ] 3.03% | 56,181 | 4.2% |
[ 3.0% - 3.5% ] 3.12% | 2,825 | 1.5% |
[ 3.0% - 3.5% ] 3.17% | 46,331 | 2.7% |
[ 3.0% - 3.5% ] 3.26% | 55,863 | 2.4% |
[ 3.0% - 3.5% ] 3.30% | 12,442 | 1.6% |
[ 3.0% - 3.5% ] 3.39% | 40,738 | 3.4% |
[ 3.0% - 3.5% ] 3.47% | 27,641 | 2.3% |
[ 3.5% - 4.0% ] 3.52% | 33,367 | 4.4% |
[ 3.5% - 4.0% ] 3.53% | 29,006 | 3.2% |
[ 3.5% - 4.0% ] 3.56% | 843 | 1.0% |
[ 3.5% - 4.0% ] 3.76% | 4,419 | 0.92% |
[ 3.5% - 4.0% ] 3.99% | 86,804 | 3.2% |
[ 4.0% - 4.5% ] 4.02% | 58,106 | 3.2% |
[ 4.0% - 4.5% ] 4.05% | 22,654 | 1.8% |
[ 4.0% - 4.5% ] 4.39% | 456 | 0.25% |
[ 4.0% - 4.5% ] 4.39% | 43,903 | 2.2% |
[ 4.5% - 5.0% ] 4.50% | 59,453 | 2.2% |
[ 4.5% - 5.0% ] 4.55% | 132 | 3.8% |
[ 4.5% - 5.0% ] 4.62% | 909 | 1.6% |
[ 4.5% - 5.0% ] 4.73% | 14,225 | 1.7% |
[ 4.5% - 5.0% ] 4.98% | 45,650 | 3.0% |
[ 5.0% - 5.5% ] 5.30% | 283 | 4.0% |
[ 5.5% - 6.0% ] 5.52% | 6,975 | 1.2% |
[ 6.0% - 6.5% ] 6.25% | 480 | 1.7% |
[ 6.5% - 7.0% ] 6.96% | 158 | 3.8% |