Immigrants from Hong Kong Married-couple Households
COMPARE
Immigrants from Hong Kong
Select to Compare
Married-couple Households
Immigrants from Hong Kong Married-couple Households
49.6%
MARRIED-COUPLE HOUSEHOLDS
99.9/ 100
METRIC RATING
17th/ 347
METRIC RANK
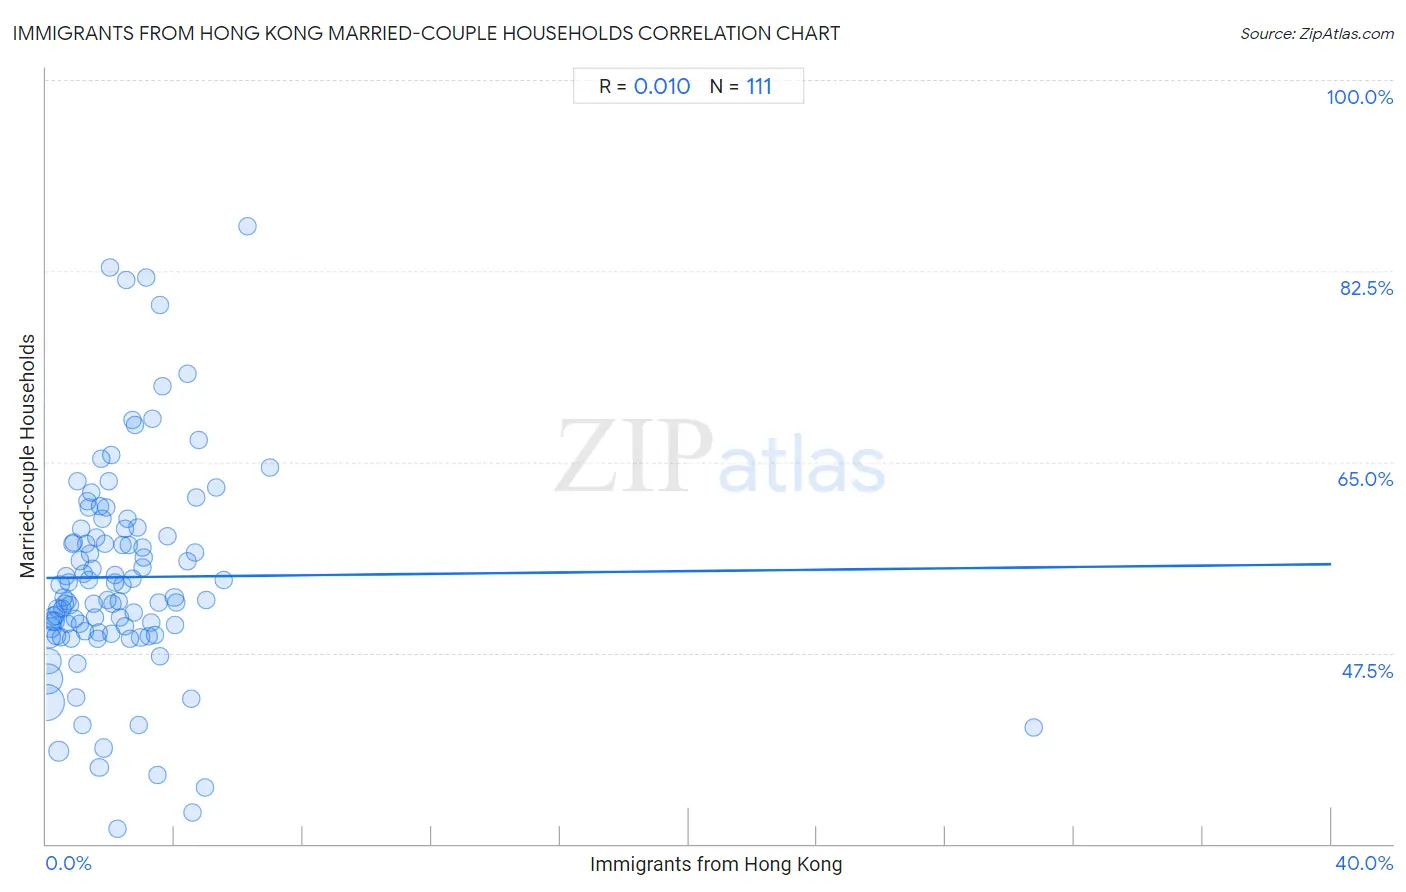
Immigrants from Hong Kong Married-couple Households Correlation Chart
The statistical analysis conducted on geographies consisting of 253,895,593 people shows no correlation between the proportion of Immigrants from Hong Kong and percentage of married-couple family households in the United States with a correlation coefficient (R) of 0.010 and weighted average of 49.6%. On average, for every 1% (one percent) increase in Immigrants from Hong Kong within a typical geography, there is an increase of 0.031% in percentage of married-couple family households.
It is essential to understand that the correlation between the percentage of Immigrants from Hong Kong and percentage of married-couple family households does not imply a direct cause-and-effect relationship. It remains uncertain whether the presence of Immigrants from Hong Kong influences an upward or downward trend in the level of percentage of married-couple family households within an area, or if Immigrants from Hong Kong simply ended up residing in those areas with higher or lower levels of percentage of married-couple family households due to other factors.
Demographics Similar to Immigrants from Hong Kong by Married-couple Households
In terms of married-couple households, the demographic groups most similar to Immigrants from Hong Kong are English (49.6%, a difference of 0.010%), Swedish (49.7%, a difference of 0.15%), European (49.6%, a difference of 0.17%), Scandinavian (49.6%, a difference of 0.17%), and Korean (49.7%, a difference of 0.18%).
| Demographics | Rating | Rank | Married-couple Households |
| Chinese | 100.0 /100 | #10 | Exceptional 50.4% |
| Immigrants from Pakistan | 100.0 /100 | #11 | Exceptional 50.1% |
| Swiss | 100.0 /100 | #12 | Exceptional 49.9% |
| Immigrants from Korea | 100.0 /100 | #13 | Exceptional 49.9% |
| Burmese | 100.0 /100 | #14 | Exceptional 49.8% |
| Koreans | 99.9 /100 | #15 | Exceptional 49.7% |
| Swedes | 99.9 /100 | #16 | Exceptional 49.7% |
| Immigrants from Hong Kong | 99.9 /100 | #17 | Exceptional 49.6% |
| English | 99.9 /100 | #18 | Exceptional 49.6% |
| Europeans | 99.9 /100 | #19 | Exceptional 49.6% |
| Scandinavians | 99.9 /100 | #20 | Exceptional 49.6% |
| Norwegians | 99.9 /100 | #21 | Exceptional 49.5% |
| Asians | 99.9 /100 | #22 | Exceptional 49.5% |
| Dutch | 99.9 /100 | #23 | Exceptional 49.5% |
| Czechs | 99.9 /100 | #24 | Exceptional 49.4% |
Immigrants from Hong Kong Married-couple Households Correlation Summary
| Measurement | Immigrants from Hong Kong Data | Married-couple Households Data |
| Minimum | 0.018% | 31.4% |
| Maximum | 30.7% | 86.6% |
| Range | 30.7% | 55.2% |
| Mean | 2.4% | 54.4% |
| Median | 1.9% | 52.5% |
| Interquartile 25% (IQ1) | 0.96% | 49.3% |
| Interquartile 75% (IQ3) | 3.1% | 58.8% |
| Interquartile Range (IQR) | 2.2% | 9.5% |
| Standard Deviation (Sample) | 3.1% | 9.9% |
| Standard Deviation (Population) | 3.1% | 9.9% |
Correlation Details
| Immigrants from Hong Kong Percentile | Sample Size | Married-couple Households |
[ 0.0% - 0.5% ] 0.018% | 79,880,814 | 43.0% |
[ 0.0% - 0.5% ] 0.051% | 52,292,396 | 45.2% |
[ 0.0% - 0.5% ] 0.088% | 32,761,925 | 46.7% |
[ 0.0% - 0.5% ] 0.12% | 17,361,804 | 48.9% |
[ 0.0% - 0.5% ] 0.16% | 10,561,157 | 49.9% |
[ 0.0% - 0.5% ] 0.19% | 7,289,578 | 50.4% |
[ 0.0% - 0.5% ] 0.23% | 6,049,831 | 50.8% |
[ 0.0% - 0.5% ] 0.26% | 5,154,823 | 50.4% |
[ 0.0% - 0.5% ] 0.30% | 2,952,522 | 50.9% |
[ 0.0% - 0.5% ] 0.33% | 3,650,408 | 49.0% |
[ 0.0% - 0.5% ] 0.37% | 1,979,755 | 51.5% |
[ 0.0% - 0.5% ] 0.40% | 10,465,848 | 38.5% |
[ 0.0% - 0.5% ] 0.44% | 3,020,949 | 53.8% |
[ 0.0% - 0.5% ] 0.47% | 2,183,133 | 48.9% |
[ 0.5% - 1.0% ] 0.50% | 1,380,285 | 51.6% |
[ 0.5% - 1.0% ] 0.54% | 915,839 | 52.5% |
[ 0.5% - 1.0% ] 0.57% | 972,868 | 52.0% |
[ 0.5% - 1.0% ] 0.61% | 1,193,966 | 54.6% |
[ 0.5% - 1.0% ] 0.65% | 1,077,444 | 52.2% |
[ 0.5% - 1.0% ] 0.68% | 741,865 | 50.1% |
[ 0.5% - 1.0% ] 0.71% | 597,438 | 53.9% |
[ 0.5% - 1.0% ] 0.75% | 287,240 | 51.9% |
[ 0.5% - 1.0% ] 0.79% | 740,407 | 48.8% |
[ 0.5% - 1.0% ] 0.82% | 468,907 | 57.5% |
[ 0.5% - 1.0% ] 0.86% | 440,810 | 57.6% |
[ 0.5% - 1.0% ] 0.88% | 367,951 | 50.6% |
[ 0.5% - 1.0% ] 0.91% | 191,191 | 43.4% |
[ 0.5% - 1.0% ] 0.96% | 250,748 | 46.5% |
[ 0.5% - 1.0% ] 0.99% | 300,407 | 63.2% |
[ 1.0% - 1.5% ] 1.03% | 417,451 | 56.0% |
[ 1.0% - 1.5% ] 1.06% | 217,562 | 50.1% |
[ 1.0% - 1.5% ] 1.10% | 601,687 | 58.8% |
[ 1.0% - 1.5% ] 1.12% | 115,218 | 40.9% |
[ 1.0% - 1.5% ] 1.16% | 269,374 | 54.8% |
[ 1.0% - 1.5% ] 1.20% | 313,344 | 49.5% |
[ 1.0% - 1.5% ] 1.23% | 292,806 | 57.5% |
[ 1.0% - 1.5% ] 1.28% | 455,873 | 61.4% |
[ 1.0% - 1.5% ] 1.31% | 111,763 | 60.8% |
[ 1.0% - 1.5% ] 1.33% | 123,011 | 54.1% |
[ 1.0% - 1.5% ] 1.38% | 217,322 | 56.6% |
[ 1.0% - 1.5% ] 1.41% | 213,981 | 62.2% |
[ 1.0% - 1.5% ] 1.44% | 165,074 | 55.2% |
[ 1.0% - 1.5% ] 1.47% | 89,020 | 51.9% |
[ 1.5% - 2.0% ] 1.53% | 187,655 | 50.8% |
[ 1.5% - 2.0% ] 1.55% | 195,259 | 58.0% |
[ 1.5% - 2.0% ] 1.59% | 104,589 | 48.8% |
[ 1.5% - 2.0% ] 1.62% | 103,875 | 49.3% |
[ 1.5% - 2.0% ] 1.65% | 144,103 | 37.0% |
[ 1.5% - 2.0% ] 1.69% | 212,977 | 60.9% |
[ 1.5% - 2.0% ] 1.73% | 69,708 | 65.3% |
[ 1.5% - 2.0% ] 1.75% | 198,364 | 59.8% |
[ 1.5% - 2.0% ] 1.79% | 940,493 | 38.8% |
[ 1.5% - 2.0% ] 1.82% | 135,694 | 57.5% |
[ 1.5% - 2.0% ] 1.86% | 194,065 | 60.8% |
[ 1.5% - 2.0% ] 1.89% | 199,304 | 52.4% |
[ 1.5% - 2.0% ] 1.93% | 58,705 | 63.3% |
[ 1.5% - 2.0% ] 1.97% | 6,238 | 82.9% |
[ 2.0% - 2.5% ] 2.01% | 61,312 | 49.3% |
[ 2.0% - 2.5% ] 2.03% | 4,336 | 65.6% |
[ 2.0% - 2.5% ] 2.08% | 67,785 | 52.0% |
[ 2.0% - 2.5% ] 2.12% | 70,245 | 53.9% |
[ 2.0% - 2.5% ] 2.14% | 104,605 | 54.6% |
[ 2.0% - 2.5% ] 2.21% | 634 | 31.4% |
[ 2.0% - 2.5% ] 2.25% | 195,750 | 52.2% |
[ 2.0% - 2.5% ] 2.31% | 10,292 | 50.8% |
[ 2.0% - 2.5% ] 2.37% | 169 | 53.7% |
[ 2.0% - 2.5% ] 2.38% | 121,317 | 57.4% |
[ 2.0% - 2.5% ] 2.43% | 40,451 | 49.9% |
[ 2.0% - 2.5% ] 2.45% | 43,851 | 58.9% |
[ 2.5% - 3.0% ] 2.51% | 6,145 | 81.7% |
[ 2.5% - 3.0% ] 2.52% | 79,589 | 59.8% |
[ 2.5% - 3.0% ] 2.56% | 20,272 | 57.4% |
[ 2.5% - 3.0% ] 2.61% | 66,979 | 48.8% |
[ 2.5% - 3.0% ] 2.67% | 43,141 | 68.9% |
[ 2.5% - 3.0% ] 2.68% | 65,125 | 54.3% |
[ 2.5% - 3.0% ] 2.73% | 24,344 | 51.2% |
[ 2.5% - 3.0% ] 2.78% | 31,447 | 68.4% |
[ 2.5% - 3.0% ] 2.86% | 525 | 59.0% |
[ 2.5% - 3.0% ] 2.89% | 19,928 | 40.9% |
[ 2.5% - 3.0% ] 2.94% | 239,314 | 48.9% |
[ 2.5% - 3.0% ] 2.99% | 21,738 | 57.2% |
[ 3.0% - 3.5% ] 3.01% | 18,426 | 55.3% |
[ 3.0% - 3.5% ] 3.03% | 56,181 | 56.3% |
[ 3.0% - 3.5% ] 3.12% | 2,825 | 81.9% |
[ 3.0% - 3.5% ] 3.17% | 46,331 | 49.0% |
[ 3.0% - 3.5% ] 3.26% | 55,863 | 50.2% |
[ 3.0% - 3.5% ] 3.30% | 12,442 | 69.0% |
[ 3.0% - 3.5% ] 3.39% | 40,738 | 49.1% |
[ 3.0% - 3.5% ] 3.47% | 27,641 | 36.3% |
[ 3.5% - 4.0% ] 3.52% | 33,367 | 52.2% |
[ 3.5% - 4.0% ] 3.53% | 29,006 | 47.2% |
[ 3.5% - 4.0% ] 3.56% | 843 | 79.4% |
[ 3.5% - 4.0% ] 3.61% | 83 | 71.9% |
[ 3.5% - 4.0% ] 3.76% | 4,419 | 58.2% |
[ 3.5% - 4.0% ] 3.99% | 86,804 | 52.6% |
[ 4.0% - 4.5% ] 4.02% | 58,106 | 50.0% |
[ 4.0% - 4.5% ] 4.05% | 22,654 | 52.1% |
[ 4.0% - 4.5% ] 4.39% | 456 | 73.0% |
[ 4.0% - 4.5% ] 4.39% | 43,903 | 55.8% |
[ 4.5% - 5.0% ] 4.50% | 59,453 | 43.3% |
[ 4.5% - 5.0% ] 4.55% | 132 | 32.8% |
[ 4.5% - 5.0% ] 4.62% | 909 | 56.7% |
[ 4.5% - 5.0% ] 4.67% | 321 | 61.7% |
[ 4.5% - 5.0% ] 4.73% | 14,225 | 67.0% |
[ 4.5% - 5.0% ] 4.93% | 609 | 35.1% |
[ 4.5% - 5.0% ] 4.98% | 45,650 | 52.3% |
[ 5.0% - 5.5% ] 5.30% | 283 | 62.6% |
[ 5.5% - 6.0% ] 5.52% | 6,975 | 54.2% |
[ 6.0% - 6.5% ] 6.25% | 480 | 86.6% |
[ 6.5% - 7.0% ] 6.96% | 158 | 64.5% |
[ 30.5% - 31.0% ] 30.73% | 192 | 40.7% |