Immigrants from Hong Kong Disability Age Under 5
COMPARE
Immigrants from Hong Kong
Select to Compare
Disability Age Under 5
Immigrants from Hong Kong Disability Age Under 5
0.95%
DISABILITY | AGE UNDER 5
100.0/ 100
METRIC RATING
15th/ 347
METRIC RANK
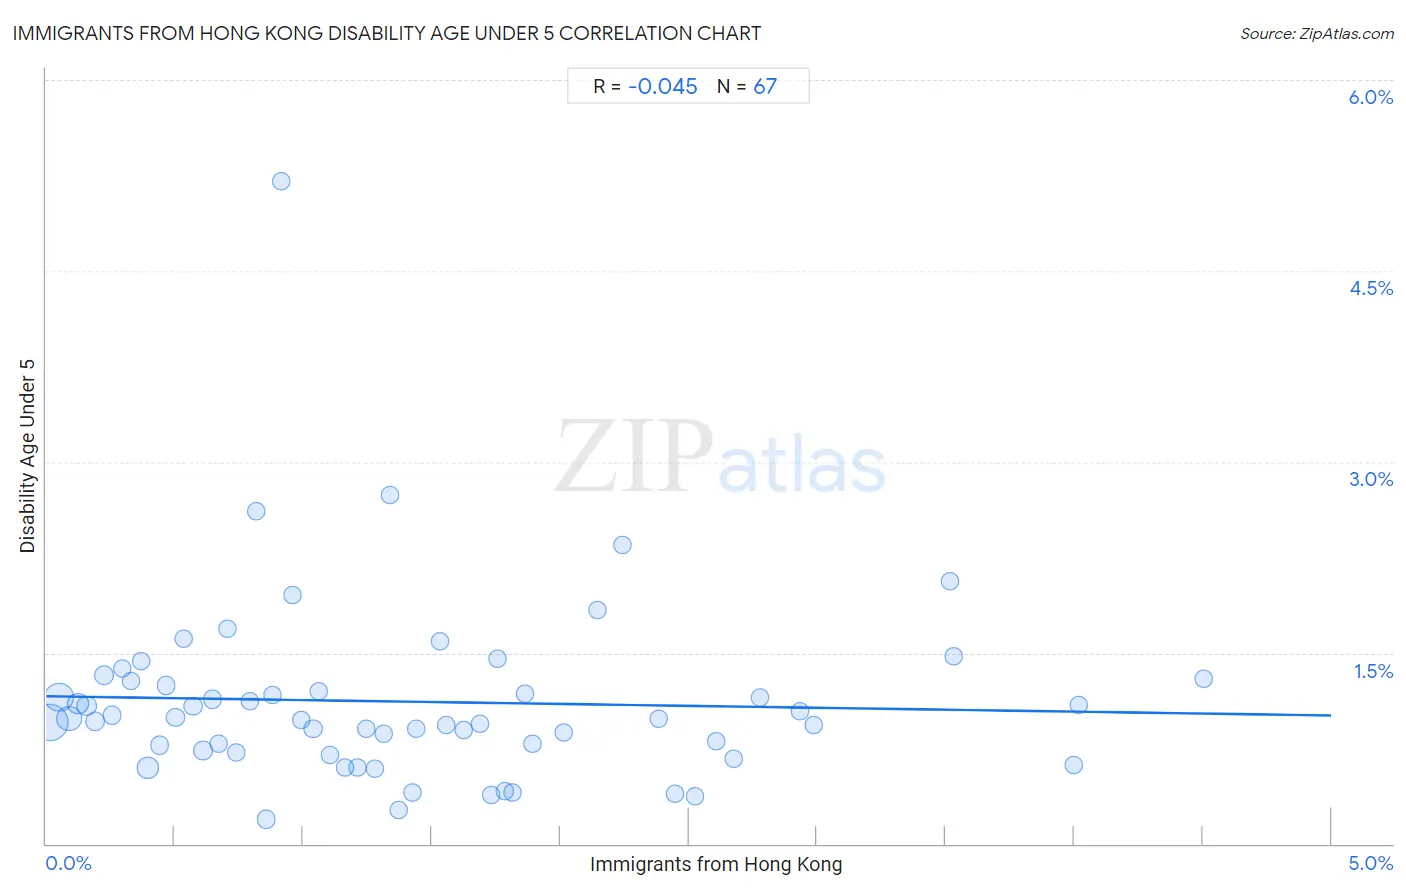
Immigrants from Hong Kong Disability Age Under 5 Correlation Chart
The statistical analysis conducted on geographies consisting of 156,756,325 people shows no correlation between the proportion of Immigrants from Hong Kong and percentage of population with a disability under the age of 5 in the United States with a correlation coefficient (R) of -0.045 and weighted average of 0.95%. On average, for every 1% (one percent) increase in Immigrants from Hong Kong within a typical geography, there is a decrease of 0.030% in percentage of population with a disability under the age of 5.
It is essential to understand that the correlation between the percentage of Immigrants from Hong Kong and percentage of population with a disability under the age of 5 does not imply a direct cause-and-effect relationship. It remains uncertain whether the presence of Immigrants from Hong Kong influences an upward or downward trend in the level of percentage of population with a disability under the age of 5 within an area, or if Immigrants from Hong Kong simply ended up residing in those areas with higher or lower levels of percentage of population with a disability under the age of 5 due to other factors.
Demographics Similar to Immigrants from Hong Kong by Disability Age Under 5
In terms of disability age under 5, the demographic groups most similar to Immigrants from Hong Kong are Yuman (0.95%, a difference of 0.030%), Soviet Union (0.95%, a difference of 0.11%), Immigrants from Grenada (0.94%, a difference of 0.28%), Afghan (0.94%, a difference of 0.30%), and Marshallese (0.94%, a difference of 1.1%).
| Demographics | Rating | Rank | Disability Age Under 5 |
| Immigrants from Yemen | 100.0 /100 | #8 | Exceptional 0.91% |
| Immigrants from Fiji | 100.0 /100 | #9 | Exceptional 0.92% |
| Marshallese | 100.0 /100 | #10 | Exceptional 0.94% |
| Afghans | 100.0 /100 | #11 | Exceptional 0.94% |
| Immigrants from Grenada | 100.0 /100 | #12 | Exceptional 0.94% |
| Soviet Union | 100.0 /100 | #13 | Exceptional 0.95% |
| Yuman | 100.0 /100 | #14 | Exceptional 0.95% |
| Immigrants from Hong Kong | 100.0 /100 | #15 | Exceptional 0.95% |
| Immigrants from Israel | 100.0 /100 | #16 | Exceptional 0.96% |
| Immigrants from China | 100.0 /100 | #17 | Exceptional 0.96% |
| Immigrants from Barbados | 100.0 /100 | #18 | Exceptional 0.97% |
| Puget Sound Salish | 100.0 /100 | #19 | Exceptional 0.97% |
| Nepalese | 100.0 /100 | #20 | Exceptional 0.97% |
| British West Indians | 100.0 /100 | #21 | Exceptional 0.99% |
| Immigrants from Iran | 100.0 /100 | #22 | Exceptional 1.00% |
Immigrants from Hong Kong Disability Age Under 5 Correlation Summary
| Measurement | Immigrants from Hong Kong Data | Disability Age Under 5 Data |
| Minimum | 0.017% | 0.19% |
| Maximum | 4.5% | 5.2% |
| Range | 4.5% | 5.0% |
| Mean | 1.4% | 1.1% |
| Median | 1.2% | 0.98% |
| Interquartile 25% (IQ1) | 0.57% | 0.73% |
| Interquartile 75% (IQ3) | 1.9% | 1.3% |
| Interquartile Range (IQR) | 1.3% | 0.55% |
| Standard Deviation (Sample) | 1.1% | 0.72% |
| Standard Deviation (Population) | 1.1% | 0.72% |
Correlation Details
| Immigrants from Hong Kong Percentile | Sample Size | Disability Age Under 5 |
[ 0.0% - 0.5% ] 0.017% | 57,217,026 | 0.95% |
[ 0.0% - 0.5% ] 0.051% | 32,231,036 | 1.2% |
[ 0.0% - 0.5% ] 0.089% | 20,544,754 | 0.98% |
[ 0.0% - 0.5% ] 0.12% | 8,351,611 | 1.1% |
[ 0.0% - 0.5% ] 0.16% | 5,669,803 | 1.1% |
[ 0.0% - 0.5% ] 0.19% | 3,344,532 | 0.96% |
[ 0.0% - 0.5% ] 0.23% | 2,163,077 | 1.3% |
[ 0.0% - 0.5% ] 0.26% | 2,273,498 | 1.0% |
[ 0.0% - 0.5% ] 0.30% | 1,162,605 | 1.4% |
[ 0.0% - 0.5% ] 0.33% | 1,670,616 | 1.3% |
[ 0.0% - 0.5% ] 0.37% | 615,492 | 1.4% |
[ 0.0% - 0.5% ] 0.40% | 9,437,406 | 0.59% |
[ 0.0% - 0.5% ] 0.44% | 2,305,373 | 0.77% |
[ 0.0% - 0.5% ] 0.47% | 1,015,496 | 1.2% |
[ 0.5% - 1.0% ] 0.50% | 978,739 | 0.99% |
[ 0.5% - 1.0% ] 0.54% | 481,071 | 1.6% |
[ 0.5% - 1.0% ] 0.57% | 370,028 | 1.1% |
[ 0.5% - 1.0% ] 0.61% | 735,040 | 0.73% |
[ 0.5% - 1.0% ] 0.65% | 411,754 | 1.1% |
[ 0.5% - 1.0% ] 0.67% | 413,401 | 0.78% |
[ 0.5% - 1.0% ] 0.71% | 227,659 | 1.7% |
[ 0.5% - 1.0% ] 0.74% | 93,891 | 0.72% |
[ 0.5% - 1.0% ] 0.79% | 442,936 | 1.1% |
[ 0.5% - 1.0% ] 0.82% | 118,631 | 2.6% |
[ 0.5% - 1.0% ] 0.86% | 284,080 | 0.19% |
[ 0.5% - 1.0% ] 0.88% | 196,718 | 1.2% |
[ 0.5% - 1.0% ] 0.92% | 97,807 | 5.2% |
[ 0.5% - 1.0% ] 0.96% | 47,331 | 2.0% |
[ 0.5% - 1.0% ] 0.99% | 21,140 | 0.98% |
[ 1.0% - 1.5% ] 1.04% | 151,107 | 0.91% |
[ 1.0% - 1.5% ] 1.06% | 121,657 | 1.2% |
[ 1.0% - 1.5% ] 1.10% | 206,534 | 0.69% |
[ 1.0% - 1.5% ] 1.16% | 36,176 | 0.60% |
[ 1.0% - 1.5% ] 1.21% | 94,920 | 0.60% |
[ 1.0% - 1.5% ] 1.25% | 135,418 | 0.90% |
[ 1.0% - 1.5% ] 1.28% | 406,594 | 0.59% |
[ 1.0% - 1.5% ] 1.31% | 56,454 | 0.86% |
[ 1.0% - 1.5% ] 1.34% | 33,700 | 2.7% |
[ 1.0% - 1.5% ] 1.37% | 127,913 | 0.26% |
[ 1.0% - 1.5% ] 1.42% | 43,858 | 0.40% |
[ 1.0% - 1.5% ] 1.44% | 131,741 | 0.91% |
[ 1.5% - 2.0% ] 1.53% | 77,565 | 1.6% |
[ 1.5% - 2.0% ] 1.56% | 141,945 | 0.93% |
[ 1.5% - 2.0% ] 1.62% | 53,036 | 0.90% |
[ 1.5% - 2.0% ] 1.69% | 79,495 | 0.94% |
[ 1.5% - 2.0% ] 1.73% | 61,414 | 0.38% |
[ 1.5% - 2.0% ] 1.75% | 43,458 | 1.5% |
[ 1.5% - 2.0% ] 1.79% | 851,036 | 0.41% |
[ 1.5% - 2.0% ] 1.81% | 59,763 | 0.40% |
[ 1.5% - 2.0% ] 1.87% | 72,381 | 1.2% |
[ 1.5% - 2.0% ] 1.89% | 43,286 | 0.79% |
[ 2.0% - 2.5% ] 2.01% | 44,196 | 0.88% |
[ 2.0% - 2.5% ] 2.14% | 38,124 | 1.8% |
[ 2.0% - 2.5% ] 2.24% | 86,587 | 2.3% |
[ 2.0% - 2.5% ] 2.38% | 101,265 | 0.98% |
[ 2.0% - 2.5% ] 2.45% | 43,851 | 0.39% |
[ 2.5% - 3.0% ] 2.52% | 47,209 | 0.37% |
[ 2.5% - 3.0% ] 2.61% | 53,320 | 0.80% |
[ 2.5% - 3.0% ] 2.67% | 41,377 | 0.67% |
[ 2.5% - 3.0% ] 2.78% | 28,212 | 1.1% |
[ 2.5% - 3.0% ] 2.93% | 82,295 | 1.0% |
[ 2.5% - 3.0% ] 2.99% | 21,738 | 0.94% |
[ 3.5% - 4.0% ] 3.52% | 33,367 | 2.1% |
[ 3.5% - 4.0% ] 3.53% | 29,006 | 1.5% |
[ 3.5% - 4.0% ] 4.00% | 60,386 | 0.62% |
[ 4.0% - 4.5% ] 4.02% | 33,937 | 1.1% |
[ 4.5% - 5.0% ] 4.50% | 59,453 | 1.3% |