Immigrants from Hong Kong 4 or more Vehicles in Household
COMPARE
Immigrants from Hong Kong
Select to Compare
4 or more Vehicles in Household
Immigrants from Hong Kong 4 or more Vehicles in Household
6.5%
4+ VEHICLES AVAILABLE
72.2/ 100
METRIC RATING
151st/ 347
METRIC RANK
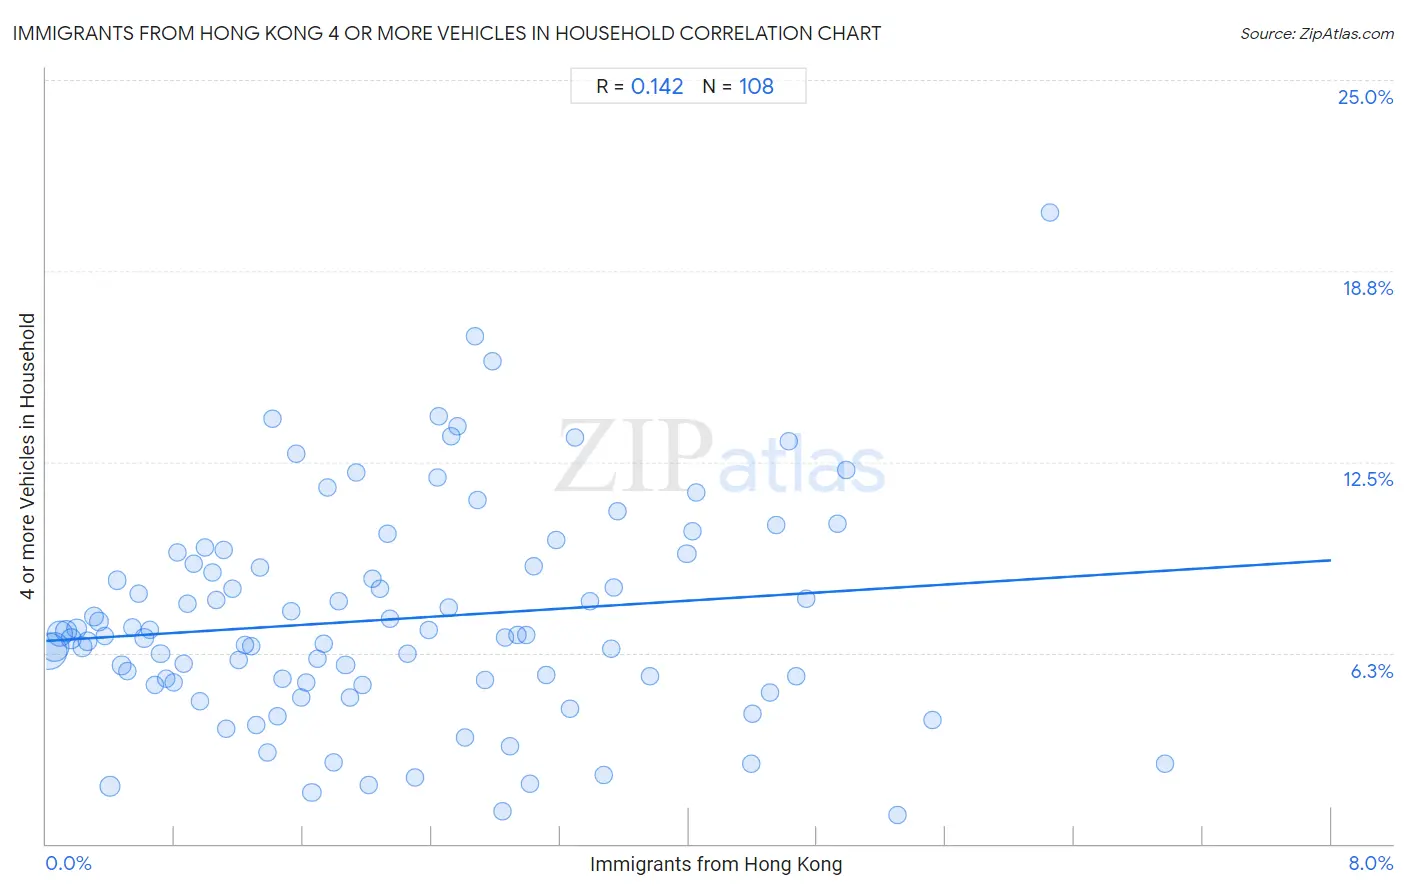
Immigrants from Hong Kong 4 or more Vehicles in Household Correlation Chart
The statistical analysis conducted on geographies consisting of 252,698,345 people shows a poor positive correlation between the proportion of Immigrants from Hong Kong and percentage of households with 4 or more vehicles available in the United States with a correlation coefficient (R) of 0.142 and weighted average of 6.5%. On average, for every 1% (one percent) increase in Immigrants from Hong Kong within a typical geography, there is an increase of 0.33% in percentage of households with 4 or more vehicles available.
It is essential to understand that the correlation between the percentage of Immigrants from Hong Kong and percentage of households with 4 or more vehicles available does not imply a direct cause-and-effect relationship. It remains uncertain whether the presence of Immigrants from Hong Kong influences an upward or downward trend in the level of percentage of households with 4 or more vehicles available within an area, or if Immigrants from Hong Kong simply ended up residing in those areas with higher or lower levels of percentage of households with 4 or more vehicles available due to other factors.
Demographics Similar to Immigrants from Hong Kong by 4 or more Vehicles in Household
In terms of 4 or more vehicles in household, the demographic groups most similar to Immigrants from Hong Kong are Yuman (6.5%, a difference of 0.010%), Immigrants from Armenia (6.5%, a difference of 0.13%), New Zealander (6.5%, a difference of 0.14%), Central American Indian (6.5%, a difference of 0.14%), and Immigrants from Jordan (6.5%, a difference of 0.18%).
| Demographics | Rating | Rank | 4 or more Vehicles in Household |
| Immigrants from North America | 78.5 /100 | #144 | Good 6.5% |
| Croatians | 77.8 /100 | #145 | Good 6.5% |
| Immigrants from Costa Rica | 74.4 /100 | #146 | Good 6.5% |
| Immigrants from Iran | 73.9 /100 | #147 | Good 6.5% |
| Immigrants from Jordan | 73.7 /100 | #148 | Good 6.5% |
| Greeks | 73.6 /100 | #149 | Good 6.5% |
| New Zealanders | 73.3 /100 | #150 | Good 6.5% |
| Immigrants from Hong Kong | 72.2 /100 | #151 | Good 6.5% |
| Yuman | 72.1 /100 | #152 | Good 6.5% |
| Immigrants from Armenia | 71.2 /100 | #153 | Good 6.5% |
| Central American Indians | 71.1 /100 | #154 | Good 6.5% |
| Iroquois | 70.4 /100 | #155 | Good 6.5% |
| Iranians | 69.9 /100 | #156 | Good 6.5% |
| Peruvians | 69.4 /100 | #157 | Good 6.5% |
| Zimbabweans | 67.1 /100 | #158 | Good 6.4% |
Immigrants from Hong Kong 4 or more Vehicles in Household Correlation Summary
| Measurement | Immigrants from Hong Kong Data | 4 or more Vehicles in Household Data |
| Minimum | 0.018% | 0.93% |
| Maximum | 7.0% | 20.7% |
| Range | 6.9% | 19.7% |
| Mean | 2.2% | 7.3% |
| Median | 1.9% | 6.8% |
| Interquartile 25% (IQ1) | 0.94% | 5.3% |
| Interquartile 75% (IQ3) | 3.0% | 9.1% |
| Interquartile Range (IQR) | 2.1% | 3.9% |
| Standard Deviation (Sample) | 1.5% | 3.5% |
| Standard Deviation (Population) | 1.5% | 3.5% |
Correlation Details
| Immigrants from Hong Kong Percentile | Sample Size | 4 or more Vehicles in Household |
[ 0.0% - 0.5% ] 0.018% | 79,753,643 | 6.3% |
[ 0.0% - 0.5% ] 0.051% | 52,124,959 | 6.4% |
[ 0.0% - 0.5% ] 0.088% | 32,664,311 | 6.9% |
[ 0.0% - 0.5% ] 0.12% | 17,194,491 | 6.9% |
[ 0.0% - 0.5% ] 0.16% | 10,504,045 | 6.7% |
[ 0.0% - 0.5% ] 0.19% | 7,170,004 | 7.1% |
[ 0.0% - 0.5% ] 0.23% | 5,962,394 | 6.4% |
[ 0.0% - 0.5% ] 0.26% | 5,129,196 | 6.6% |
[ 0.0% - 0.5% ] 0.30% | 2,936,729 | 7.4% |
[ 0.0% - 0.5% ] 0.33% | 3,631,925 | 7.3% |
[ 0.0% - 0.5% ] 0.37% | 1,950,412 | 6.8% |
[ 0.0% - 0.5% ] 0.40% | 10,374,290 | 1.9% |
[ 0.0% - 0.5% ] 0.44% | 3,020,949 | 8.6% |
[ 0.0% - 0.5% ] 0.47% | 2,167,887 | 5.8% |
[ 0.5% - 1.0% ] 0.50% | 1,345,381 | 5.6% |
[ 0.5% - 1.0% ] 0.54% | 915,839 | 7.1% |
[ 0.5% - 1.0% ] 0.57% | 966,418 | 8.2% |
[ 0.5% - 1.0% ] 0.61% | 1,193,966 | 6.7% |
[ 0.5% - 1.0% ] 0.65% | 1,056,228 | 7.0% |
[ 0.5% - 1.0% ] 0.68% | 736,496 | 5.2% |
[ 0.5% - 1.0% ] 0.71% | 595,193 | 6.2% |
[ 0.5% - 1.0% ] 0.75% | 268,280 | 5.4% |
[ 0.5% - 1.0% ] 0.79% | 740,407 | 5.3% |
[ 0.5% - 1.0% ] 0.82% | 468,907 | 9.5% |
[ 0.5% - 1.0% ] 0.86% | 439,766 | 5.9% |
[ 0.5% - 1.0% ] 0.88% | 359,608 | 7.9% |
[ 0.5% - 1.0% ] 0.91% | 190,977 | 9.2% |
[ 0.5% - 1.0% ] 0.96% | 250,748 | 4.7% |
[ 0.5% - 1.0% ] 0.99% | 299,300 | 9.7% |
[ 1.0% - 1.5% ] 1.03% | 409,945 | 8.9% |
[ 1.0% - 1.5% ] 1.06% | 201,318 | 8.0% |
[ 1.0% - 1.5% ] 1.10% | 596,365 | 9.6% |
[ 1.0% - 1.5% ] 1.12% | 115,218 | 3.8% |
[ 1.0% - 1.5% ] 1.16% | 269,374 | 8.4% |
[ 1.0% - 1.5% ] 1.20% | 309,785 | 6.0% |
[ 1.0% - 1.5% ] 1.23% | 284,389 | 6.5% |
[ 1.0% - 1.5% ] 1.28% | 455,405 | 6.5% |
[ 1.0% - 1.5% ] 1.31% | 111,763 | 3.9% |
[ 1.0% - 1.5% ] 1.33% | 123,011 | 9.1% |
[ 1.0% - 1.5% ] 1.38% | 217,322 | 3.0% |
[ 1.0% - 1.5% ] 1.41% | 213,981 | 13.9% |
[ 1.0% - 1.5% ] 1.44% | 165,074 | 4.2% |
[ 1.0% - 1.5% ] 1.47% | 89,020 | 5.4% |
[ 1.5% - 2.0% ] 1.53% | 181,497 | 7.6% |
[ 1.5% - 2.0% ] 1.55% | 195,259 | 12.8% |
[ 1.5% - 2.0% ] 1.59% | 104,589 | 4.8% |
[ 1.5% - 2.0% ] 1.62% | 103,875 | 5.3% |
[ 1.5% - 2.0% ] 1.65% | 144,103 | 1.7% |
[ 1.5% - 2.0% ] 1.69% | 212,977 | 6.0% |
[ 1.5% - 2.0% ] 1.73% | 69,708 | 6.5% |
[ 1.5% - 2.0% ] 1.75% | 198,364 | 11.7% |
[ 1.5% - 2.0% ] 1.79% | 925,445 | 2.7% |
[ 1.5% - 2.0% ] 1.82% | 131,115 | 8.0% |
[ 1.5% - 2.0% ] 1.86% | 193,107 | 5.9% |
[ 1.5% - 2.0% ] 1.89% | 199,304 | 4.8% |
[ 1.5% - 2.0% ] 1.93% | 58,705 | 12.2% |
[ 1.5% - 2.0% ] 1.97% | 6,238 | 5.2% |
[ 2.0% - 2.5% ] 2.01% | 61,312 | 1.9% |
[ 2.0% - 2.5% ] 2.03% | 4,336 | 8.7% |
[ 2.0% - 2.5% ] 2.08% | 67,785 | 8.3% |
[ 2.0% - 2.5% ] 2.12% | 70,245 | 10.1% |
[ 2.0% - 2.5% ] 2.14% | 104,605 | 7.4% |
[ 2.0% - 2.5% ] 2.25% | 195,750 | 6.2% |
[ 2.0% - 2.5% ] 2.30% | 87 | 2.2% |
[ 2.0% - 2.5% ] 2.38% | 121,317 | 7.0% |
[ 2.0% - 2.5% ] 2.43% | 40,451 | 12.0% |
[ 2.0% - 2.5% ] 2.45% | 43,851 | 14.0% |
[ 2.5% - 3.0% ] 2.51% | 6,145 | 7.8% |
[ 2.5% - 3.0% ] 2.52% | 79,589 | 13.3% |
[ 2.5% - 3.0% ] 2.56% | 20,272 | 13.7% |
[ 2.5% - 3.0% ] 2.61% | 66,979 | 3.5% |
[ 2.5% - 3.0% ] 2.67% | 42,916 | 16.6% |
[ 2.5% - 3.0% ] 2.68% | 65,125 | 11.3% |
[ 2.5% - 3.0% ] 2.73% | 24,344 | 5.4% |
[ 2.5% - 3.0% ] 2.78% | 31,447 | 15.8% |
[ 2.5% - 3.0% ] 2.84% | 2,079 | 1.1% |
[ 2.5% - 3.0% ] 2.86% | 525 | 6.7% |
[ 2.5% - 3.0% ] 2.89% | 19,928 | 3.2% |
[ 2.5% - 3.0% ] 2.94% | 239,314 | 6.8% |
[ 2.5% - 3.0% ] 2.99% | 21,738 | 6.8% |
[ 3.0% - 3.5% ] 3.01% | 18,426 | 2.0% |
[ 3.0% - 3.5% ] 3.03% | 56,181 | 9.1% |
[ 3.0% - 3.5% ] 3.12% | 2,825 | 5.5% |
[ 3.0% - 3.5% ] 3.17% | 46,331 | 10.0% |
[ 3.0% - 3.5% ] 3.26% | 55,863 | 4.4% |
[ 3.0% - 3.5% ] 3.30% | 12,442 | 13.3% |
[ 3.0% - 3.5% ] 3.39% | 40,738 | 7.9% |
[ 3.0% - 3.5% ] 3.47% | 27,641 | 2.3% |
[ 3.5% - 4.0% ] 3.52% | 33,367 | 6.4% |
[ 3.5% - 4.0% ] 3.53% | 29,006 | 8.4% |
[ 3.5% - 4.0% ] 3.56% | 843 | 10.9% |
[ 3.5% - 4.0% ] 3.76% | 4,419 | 5.5% |
[ 3.5% - 4.0% ] 3.99% | 86,804 | 9.5% |
[ 4.0% - 4.5% ] 4.02% | 58,106 | 10.2% |
[ 4.0% - 4.5% ] 4.05% | 22,654 | 11.5% |
[ 4.0% - 4.5% ] 4.39% | 456 | 2.6% |
[ 4.0% - 4.5% ] 4.39% | 43,903 | 4.3% |
[ 4.5% - 5.0% ] 4.50% | 59,453 | 5.0% |
[ 4.5% - 5.0% ] 4.55% | 132 | 10.4% |
[ 4.5% - 5.0% ] 4.62% | 909 | 13.2% |
[ 4.5% - 5.0% ] 4.67% | 321 | 5.5% |
[ 4.5% - 5.0% ] 4.73% | 14,225 | 8.0% |
[ 4.5% - 5.0% ] 4.93% | 609 | 10.5% |
[ 4.5% - 5.0% ] 4.98% | 45,650 | 12.2% |
[ 5.0% - 5.5% ] 5.30% | 283 | 0.93% |
[ 5.5% - 6.0% ] 5.52% | 6,975 | 4.1% |
[ 6.0% - 6.5% ] 6.25% | 480 | 20.7% |
[ 6.5% - 7.0% ] 6.96% | 158 | 2.6% |