Immigrants from Guatemala Wage/Income Gap
COMPARE
Immigrants from Guatemala
Select to Compare
Wage/Income Gap
Immigrants from Guatemala Wage/Income Gap
22.5%
WAGE/INCOME GAP
100.0/ 100
METRIC RATING
62nd/ 347
METRIC RANK
Immigrants from Guatemala Wage/Income Gap Correlation Chart
The statistical analysis conducted on geographies consisting of 377,062,007 people shows a poor positive correlation between the proportion of Immigrants from Guatemala and wage/income gap percentage in the United States with a correlation coefficient (R) of 0.192 and weighted average of 22.5%. On average, for every 1% (one percent) increase in Immigrants from Guatemala within a typical geography, there is an increase of 0.16% in wage/income gap percentage.
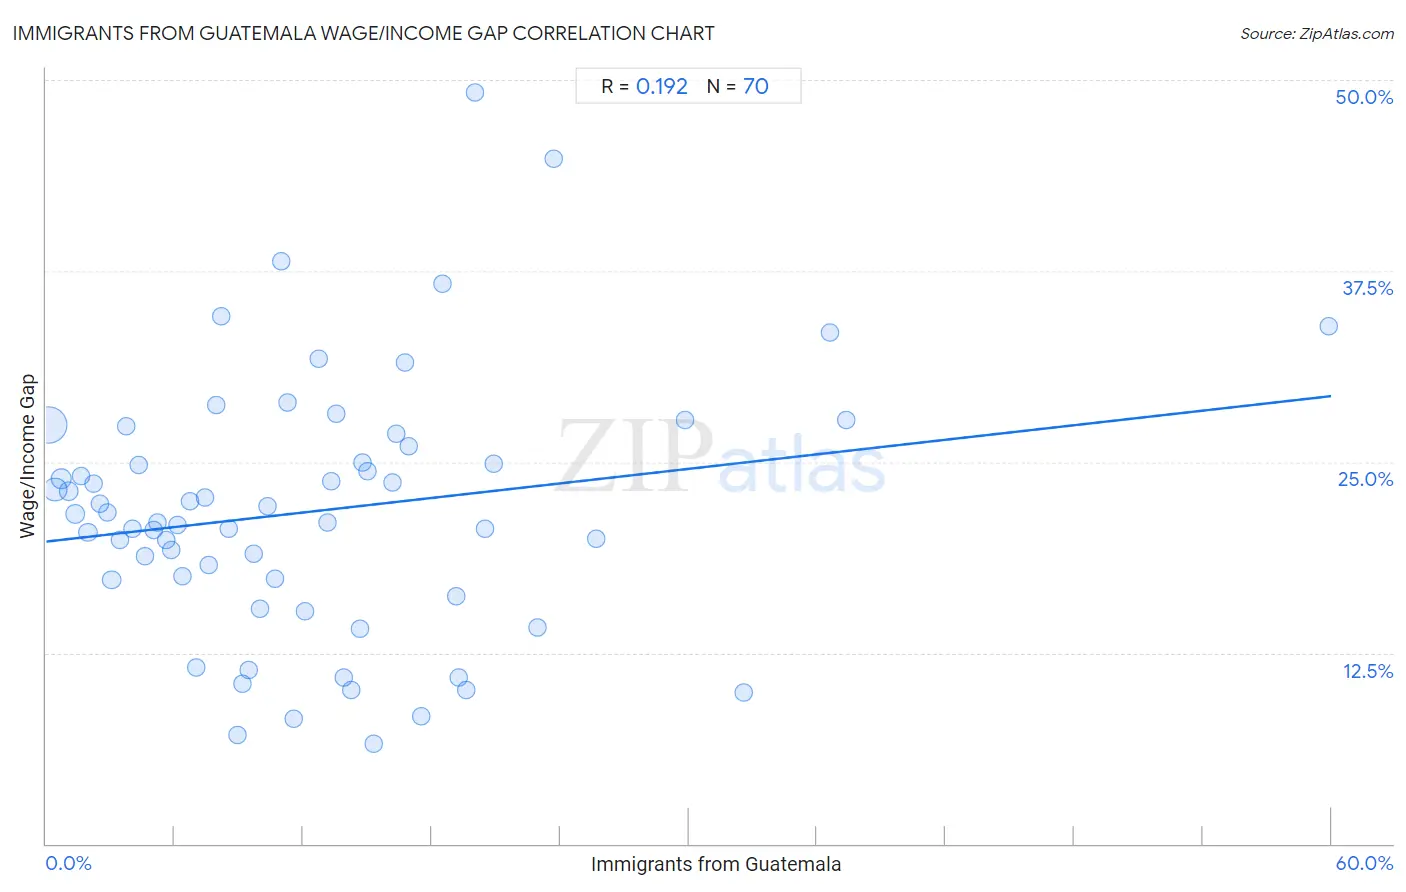
It is essential to understand that the correlation between the percentage of Immigrants from Guatemala and wage/income gap percentage does not imply a direct cause-and-effect relationship. It remains uncertain whether the presence of Immigrants from Guatemala influences an upward or downward trend in the level of wage/income gap percentage within an area, or if Immigrants from Guatemala simply ended up residing in those areas with higher or lower levels of wage/income gap percentage due to other factors.
Demographics Similar to Immigrants from Guatemala by Wage/Income Gap
In terms of wage/income gap, the demographic groups most similar to Immigrants from Guatemala are Immigrants from Ecuador (22.5%, a difference of 0.14%), Immigrants from Fiji (22.4%, a difference of 0.21%), Immigrants from Middle Africa (22.4%, a difference of 0.38%), Navajo (22.4%, a difference of 0.40%), and Spanish American Indian (22.5%, a difference of 0.43%).
| Demographics | Rating | Rank | Wage/Income Gap |
| Immigrants from Zaire | 100.0 /100 | #55 | Exceptional 22.3% |
| Immigrants from Ghana | 100.0 /100 | #56 | Exceptional 22.3% |
| Ghanaians | 100.0 /100 | #57 | Exceptional 22.3% |
| Immigrants from Cuba | 100.0 /100 | #58 | Exceptional 22.4% |
| Navajo | 100.0 /100 | #59 | Exceptional 22.4% |
| Immigrants from Middle Africa | 100.0 /100 | #60 | Exceptional 22.4% |
| Immigrants from Fiji | 100.0 /100 | #61 | Exceptional 22.4% |
| Immigrants from Guatemala | 100.0 /100 | #62 | Exceptional 22.5% |
| Immigrants from Ecuador | 100.0 /100 | #63 | Exceptional 22.5% |
| Spanish American Indians | 100.0 /100 | #64 | Exceptional 22.5% |
| Guatemalans | 99.9 /100 | #65 | Exceptional 22.6% |
| Central American Indians | 99.9 /100 | #66 | Exceptional 22.7% |
| Menominee | 99.9 /100 | #67 | Exceptional 22.7% |
| Immigrants from Nigeria | 99.9 /100 | #68 | Exceptional 22.7% |
| Indonesians | 99.9 /100 | #69 | Exceptional 22.7% |
Immigrants from Guatemala Wage/Income Gap Correlation Summary
| Measurement | Immigrants from Guatemala Data | Wage/Income Gap Data |
| Minimum | 0.12% | 6.6% |
| Maximum | 59.9% | 49.2% |
| Range | 59.8% | 42.6% |
| Mean | 12.4% | 21.8% |
| Median | 10.5% | 21.3% |
| Interquartile 25% (IQ1) | 5.2% | 17.3% |
| Interquartile 75% (IQ3) | 16.7% | 26.1% |
| Interquartile Range (IQR) | 11.5% | 8.8% |
| Standard Deviation (Sample) | 10.2% | 8.5% |
| Standard Deviation (Population) | 10.2% | 8.4% |
Correlation Details
| Immigrants from Guatemala Percentile | Sample Size | Wage/Income Gap |
[ 0.0% - 0.5% ] 0.12% | 223,939,749 | 27.4% |
[ 0.0% - 0.5% ] 0.42% | 70,645,047 | 23.2% |
[ 0.5% - 1.0% ] 0.72% | 29,029,227 | 23.9% |
[ 1.0% - 1.5% ] 1.02% | 16,104,121 | 23.1% |
[ 1.0% - 1.5% ] 1.34% | 9,891,669 | 21.6% |
[ 1.5% - 2.0% ] 1.64% | 5,032,207 | 24.1% |
[ 1.5% - 2.0% ] 1.95% | 3,745,335 | 20.4% |
[ 2.0% - 2.5% ] 2.23% | 2,817,412 | 23.6% |
[ 2.5% - 3.0% ] 2.53% | 1,365,200 | 22.2% |
[ 2.5% - 3.0% ] 2.84% | 1,972,537 | 21.7% |
[ 3.0% - 3.5% ] 3.06% | 4,682,412 | 17.3% |
[ 3.0% - 3.5% ] 3.44% | 789,788 | 19.9% |
[ 3.5% - 4.0% ] 3.74% | 925,792 | 27.3% |
[ 4.0% - 4.5% ] 4.01% | 490,465 | 20.6% |
[ 4.0% - 4.5% ] 4.30% | 380,862 | 24.8% |
[ 4.5% - 5.0% ] 4.62% | 946,907 | 18.8% |
[ 4.5% - 5.0% ] 4.99% | 262,822 | 20.6% |
[ 5.0% - 5.5% ] 5.22% | 370,152 | 21.0% |
[ 5.5% - 6.0% ] 5.58% | 409,397 | 19.9% |
[ 5.5% - 6.0% ] 5.81% | 235,334 | 19.2% |
[ 6.0% - 6.5% ] 6.11% | 615,166 | 20.8% |
[ 6.0% - 6.5% ] 6.38% | 257,432 | 17.5% |
[ 6.5% - 7.0% ] 6.72% | 368,241 | 22.4% |
[ 7.0% - 7.5% ] 7.01% | 189,443 | 11.5% |
[ 7.0% - 7.5% ] 7.40% | 123,787 | 22.7% |
[ 7.5% - 8.0% ] 7.61% | 352,019 | 18.3% |
[ 7.5% - 8.0% ] 7.94% | 130,957 | 28.8% |
[ 8.0% - 8.5% ] 8.20% | 561 | 34.5% |
[ 8.5% - 9.0% ] 8.52% | 93,181 | 20.6% |
[ 8.5% - 9.0% ] 8.90% | 59,346 | 7.1% |
[ 9.0% - 9.5% ] 9.19% | 38,641 | 10.5% |
[ 9.0% - 9.5% ] 9.46% | 31,748 | 11.3% |
[ 9.5% - 10.0% ] 9.66% | 154,334 | 19.0% |
[ 10.0% - 10.5% ] 10.01% | 62,561 | 15.3% |
[ 10.0% - 10.5% ] 10.35% | 74,296 | 22.1% |
[ 10.5% - 11.0% ] 10.66% | 47,943 | 17.3% |
[ 10.5% - 11.0% ] 10.99% | 8,854 | 38.1% |
[ 11.0% - 11.5% ] 11.25% | 1,777 | 28.9% |
[ 11.5% - 12.0% ] 11.56% | 21,433 | 8.2% |
[ 12.0% - 12.5% ] 12.08% | 1,622 | 15.2% |
[ 12.5% - 13.0% ] 12.71% | 11,184 | 31.7% |
[ 13.0% - 13.5% ] 13.13% | 11,363 | 21.0% |
[ 13.0% - 13.5% ] 13.31% | 64,350 | 23.7% |
[ 13.5% - 14.0% ] 13.57% | 2,115 | 28.2% |
[ 13.5% - 14.0% ] 13.90% | 331 | 10.9% |
[ 14.0% - 14.5% ] 14.23% | 42,188 | 10.1% |
[ 14.5% - 15.0% ] 14.64% | 9,827 | 14.1% |
[ 14.5% - 15.0% ] 14.79% | 7,905 | 25.0% |
[ 14.5% - 15.0% ] 14.98% | 43,118 | 24.4% |
[ 15.0% - 15.5% ] 15.30% | 36,578 | 6.6% |
[ 16.0% - 16.5% ] 16.16% | 51,761 | 23.6% |
[ 16.0% - 16.5% ] 16.37% | 2,389 | 26.8% |
[ 16.5% - 17.0% ] 16.73% | 3,055 | 31.5% |
[ 16.5% - 17.0% ] 16.91% | 6,488 | 26.1% |
[ 17.5% - 18.0% ] 17.52% | 8,340 | 8.4% |
[ 18.5% - 19.0% ] 18.51% | 1,275 | 36.7% |
[ 19.0% - 19.5% ] 19.15% | 1,843 | 16.2% |
[ 19.0% - 19.5% ] 19.25% | 3,538 | 10.9% |
[ 19.5% - 20.0% ] 19.59% | 47,142 | 10.1% |
[ 20.0% - 20.5% ] 20.00% | 50 | 49.2% |
[ 20.0% - 20.5% ] 20.50% | 2,205 | 20.6% |
[ 20.5% - 21.0% ] 20.92% | 7,247 | 24.9% |
[ 22.5% - 23.0% ] 22.97% | 1,389 | 14.2% |
[ 23.5% - 24.0% ] 23.70% | 211 | 44.8% |
[ 25.5% - 26.0% ] 25.70% | 2,506 | 20.0% |
[ 29.5% - 30.0% ] 29.81% | 21,778 | 27.8% |
[ 32.5% - 33.0% ] 32.56% | 129 | 9.9% |
[ 36.5% - 37.0% ] 36.61% | 631 | 33.4% |
[ 37.0% - 37.5% ] 37.36% | 182 | 27.7% |
[ 59.5% - 60.0% ] 59.89% | 1,112 | 33.9% |