Immigrants from Guatemala 4 or more Vehicles in Household
COMPARE
Immigrants from Guatemala
Select to Compare
4 or more Vehicles in Household
Immigrants from Guatemala 4 or more Vehicles in Household
6.8%
4+ VEHICLES AVAILABLE
95.8/ 100
METRIC RATING
116th/ 347
METRIC RANK
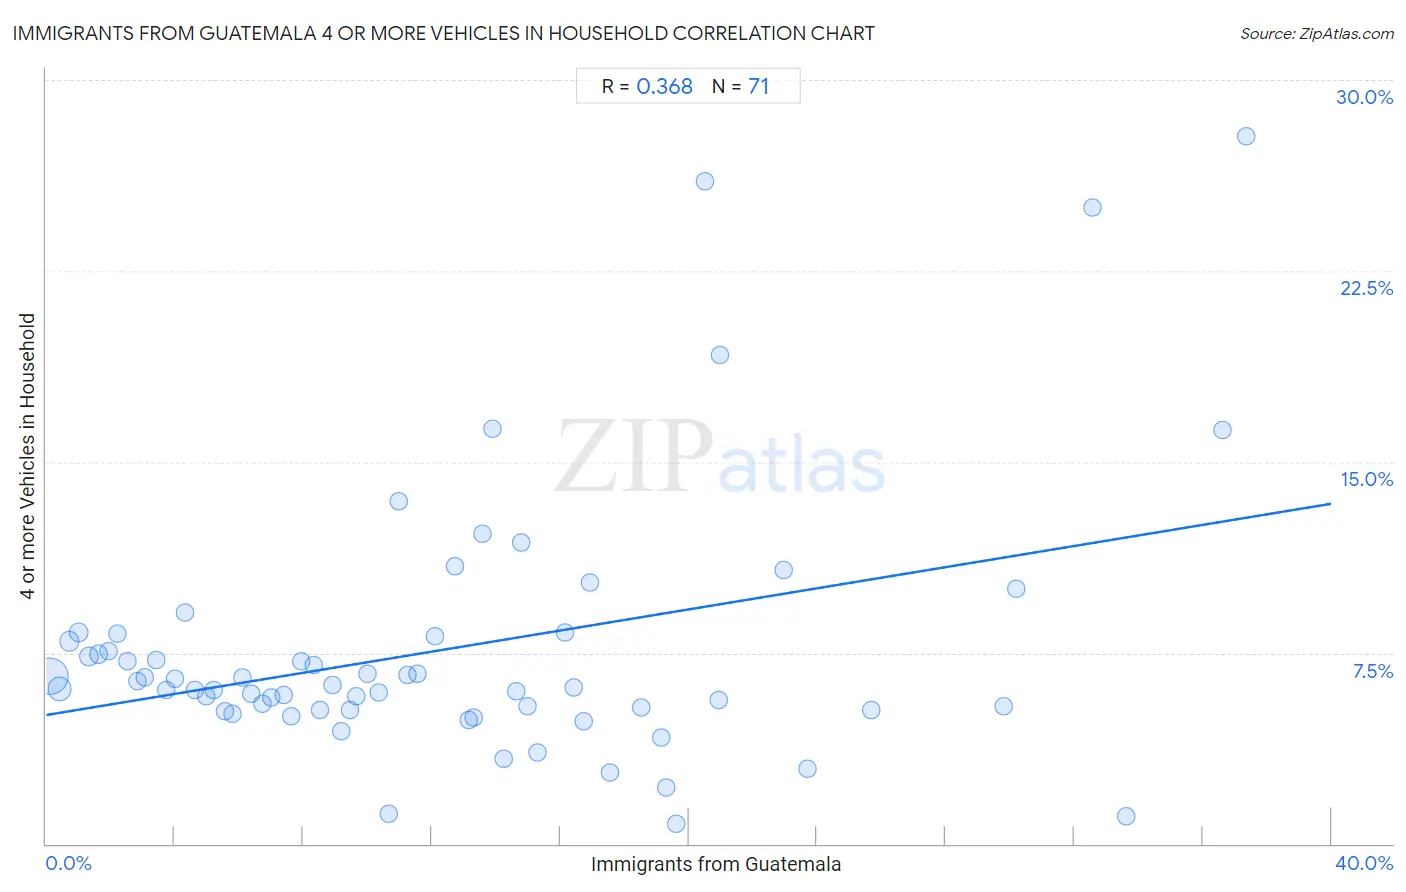
Immigrants from Guatemala 4 or more Vehicles in Household Correlation Chart
The statistical analysis conducted on geographies consisting of 375,931,655 people shows a mild positive correlation between the proportion of Immigrants from Guatemala and percentage of households with 4 or more vehicles available in the United States with a correlation coefficient (R) of 0.368 and weighted average of 6.8%. On average, for every 1% (one percent) increase in Immigrants from Guatemala within a typical geography, there is an increase of 0.21% in percentage of households with 4 or more vehicles available.
It is essential to understand that the correlation between the percentage of Immigrants from Guatemala and percentage of households with 4 or more vehicles available does not imply a direct cause-and-effect relationship. It remains uncertain whether the presence of Immigrants from Guatemala influences an upward or downward trend in the level of percentage of households with 4 or more vehicles available within an area, or if Immigrants from Guatemala simply ended up residing in those areas with higher or lower levels of percentage of households with 4 or more vehicles available due to other factors.
Demographics Similar to Immigrants from Guatemala by 4 or more Vehicles in Household
In terms of 4 or more vehicles in household, the demographic groups most similar to Immigrants from Guatemala are Burmese (6.8%, a difference of 0.020%), French American Indian (6.8%, a difference of 0.020%), Costa Rican (6.8%, a difference of 0.13%), Tlingit-Haida (6.8%, a difference of 0.26%), and Bolivian (6.8%, a difference of 0.32%).
| Demographics | Rating | Rank | 4 or more Vehicles in Household |
| Filipinos | 97.6 /100 | #109 | Exceptional 6.9% |
| Immigrants from Thailand | 97.0 /100 | #110 | Exceptional 6.9% |
| Aleuts | 97.0 /100 | #111 | Exceptional 6.9% |
| Hopi | 97.0 /100 | #112 | Exceptional 6.9% |
| Canadians | 96.4 /100 | #113 | Exceptional 6.9% |
| Bolivians | 96.3 /100 | #114 | Exceptional 6.8% |
| Tlingit-Haida | 96.2 /100 | #115 | Exceptional 6.8% |
| Immigrants from Guatemala | 95.8 /100 | #116 | Exceptional 6.8% |
| Burmese | 95.7 /100 | #117 | Exceptional 6.8% |
| French American Indians | 95.7 /100 | #118 | Exceptional 6.8% |
| Costa Ricans | 95.5 /100 | #119 | Exceptional 6.8% |
| Comanche | 94.8 /100 | #120 | Exceptional 6.8% |
| Immigrants from Germany | 94.7 /100 | #121 | Exceptional 6.8% |
| Immigrants from Nicaragua | 94.7 /100 | #122 | Exceptional 6.8% |
| Immigrants | 94.6 /100 | #123 | Exceptional 6.8% |
Immigrants from Guatemala 4 or more Vehicles in Household Correlation Summary
| Measurement | Immigrants from Guatemala Data | 4 or more Vehicles in Household Data |
| Minimum | 0.12% | 0.78% |
| Maximum | 37.4% | 27.8% |
| Range | 37.2% | 27.0% |
| Mean | 12.3% | 7.6% |
| Median | 10.7% | 6.1% |
| Interquartile 25% (IQ1) | 5.2% | 5.3% |
| Interquartile 75% (IQ3) | 16.9% | 8.1% |
| Interquartile Range (IQR) | 11.7% | 2.9% |
| Standard Deviation (Sample) | 9.1% | 5.1% |
| Standard Deviation (Population) | 9.0% | 5.1% |
Correlation Details
| Immigrants from Guatemala Percentile | Sample Size | 4 or more Vehicles in Household |
[ 0.0% - 0.5% ] 0.12% | 223,124,942 | 6.6% |
[ 0.0% - 0.5% ] 0.42% | 70,482,954 | 6.1% |
[ 0.5% - 1.0% ] 0.72% | 28,916,652 | 7.9% |
[ 1.0% - 1.5% ] 1.03% | 16,092,370 | 8.3% |
[ 1.0% - 1.5% ] 1.34% | 9,901,936 | 7.3% |
[ 1.5% - 2.0% ] 1.64% | 5,016,176 | 7.5% |
[ 1.5% - 2.0% ] 1.95% | 3,745,431 | 7.6% |
[ 2.0% - 2.5% ] 2.23% | 2,800,944 | 8.2% |
[ 2.5% - 3.0% ] 2.53% | 1,359,829 | 7.2% |
[ 2.5% - 3.0% ] 2.84% | 1,975,101 | 6.4% |
[ 3.0% - 3.5% ] 3.06% | 4,687,256 | 6.5% |
[ 3.0% - 3.5% ] 3.44% | 789,913 | 7.2% |
[ 3.5% - 4.0% ] 3.74% | 928,393 | 6.0% |
[ 4.0% - 4.5% ] 4.01% | 490,768 | 6.5% |
[ 4.0% - 4.5% ] 4.30% | 380,639 | 9.1% |
[ 4.5% - 5.0% ] 4.62% | 947,942 | 6.0% |
[ 4.5% - 5.0% ] 4.99% | 254,813 | 5.8% |
[ 5.0% - 5.5% ] 5.22% | 372,619 | 6.0% |
[ 5.5% - 6.0% ] 5.58% | 410,285 | 5.2% |
[ 5.5% - 6.0% ] 5.81% | 227,870 | 5.1% |
[ 6.0% - 6.5% ] 6.11% | 616,290 | 6.5% |
[ 6.0% - 6.5% ] 6.38% | 257,432 | 5.9% |
[ 6.5% - 7.0% ] 6.72% | 369,428 | 5.5% |
[ 7.0% - 7.5% ] 7.01% | 187,342 | 5.7% |
[ 7.0% - 7.5% ] 7.40% | 127,864 | 5.9% |
[ 7.5% - 8.0% ] 7.61% | 351,523 | 5.0% |
[ 7.5% - 8.0% ] 7.94% | 128,727 | 7.2% |
[ 8.0% - 8.5% ] 8.31% | 1,937 | 7.0% |
[ 8.5% - 9.0% ] 8.51% | 91,717 | 5.3% |
[ 8.5% - 9.0% ] 8.90% | 59,346 | 6.3% |
[ 9.0% - 9.5% ] 9.19% | 40,398 | 4.4% |
[ 9.0% - 9.5% ] 9.45% | 30,072 | 5.3% |
[ 9.5% - 10.0% ] 9.66% | 154,334 | 5.8% |
[ 10.0% - 10.5% ] 10.00% | 61,042 | 6.7% |
[ 10.0% - 10.5% ] 10.35% | 74,296 | 6.0% |
[ 10.5% - 11.0% ] 10.66% | 47,070 | 1.2% |
[ 10.5% - 11.0% ] 10.99% | 8,854 | 13.4% |
[ 11.0% - 11.5% ] 11.24% | 2,670 | 6.7% |
[ 11.5% - 12.0% ] 11.56% | 21,512 | 6.7% |
[ 12.0% - 12.5% ] 12.08% | 1,622 | 8.1% |
[ 12.5% - 13.0% ] 12.71% | 11,184 | 10.9% |
[ 13.0% - 13.5% ] 13.14% | 10,596 | 4.9% |
[ 13.0% - 13.5% ] 13.31% | 64,350 | 5.0% |
[ 13.5% - 14.0% ] 13.57% | 2,115 | 12.2% |
[ 13.5% - 14.0% ] 13.90% | 331 | 16.3% |
[ 14.0% - 14.5% ] 14.23% | 42,188 | 3.3% |
[ 14.5% - 15.0% ] 14.64% | 9,827 | 6.0% |
[ 14.5% - 15.0% ] 14.79% | 7,973 | 11.8% |
[ 14.5% - 15.0% ] 14.98% | 41,873 | 5.4% |
[ 15.0% - 15.5% ] 15.30% | 36,578 | 3.6% |
[ 16.0% - 16.5% ] 16.16% | 51,761 | 8.3% |
[ 16.0% - 16.5% ] 16.40% | 4,085 | 6.1% |
[ 16.5% - 17.0% ] 16.73% | 3,055 | 4.8% |
[ 16.5% - 17.0% ] 16.91% | 6,488 | 10.2% |
[ 17.5% - 18.0% ] 17.53% | 9,320 | 2.8% |
[ 18.5% - 19.0% ] 18.51% | 1,275 | 5.4% |
[ 19.0% - 19.5% ] 19.14% | 2,189 | 4.1% |
[ 19.0% - 19.5% ] 19.30% | 2,078 | 2.2% |
[ 19.5% - 20.0% ] 19.59% | 47,142 | 0.78% |
[ 20.0% - 20.5% ] 20.50% | 2,205 | 26.0% |
[ 20.5% - 21.0% ] 20.92% | 7,247 | 5.7% |
[ 20.5% - 21.0% ] 20.97% | 267 | 19.2% |
[ 22.5% - 23.0% ] 22.97% | 1,389 | 10.7% |
[ 23.5% - 24.0% ] 23.70% | 211 | 2.9% |
[ 25.5% - 26.0% ] 25.70% | 2,506 | 5.3% |
[ 29.5% - 30.0% ] 29.81% | 21,778 | 5.4% |
[ 30.0% - 30.5% ] 30.20% | 149 | 10.0% |
[ 32.5% - 33.0% ] 32.56% | 129 | 25.0% |
[ 33.5% - 34.0% ] 33.61% | 244 | 1.1% |
[ 36.5% - 37.0% ] 36.61% | 631 | 16.3% |
[ 37.0% - 37.5% ] 37.36% | 182 | 27.8% |