Immigrants from Guatemala GED/Equivalency
COMPARE
Immigrants from Guatemala
Select to Compare
GED/Equivalency
Immigrants from Guatemala GED/Equivalency
77.9%
GED/EQUIVALENCY
0.0/ 100
METRIC RATING
338th/ 347
METRIC RANK
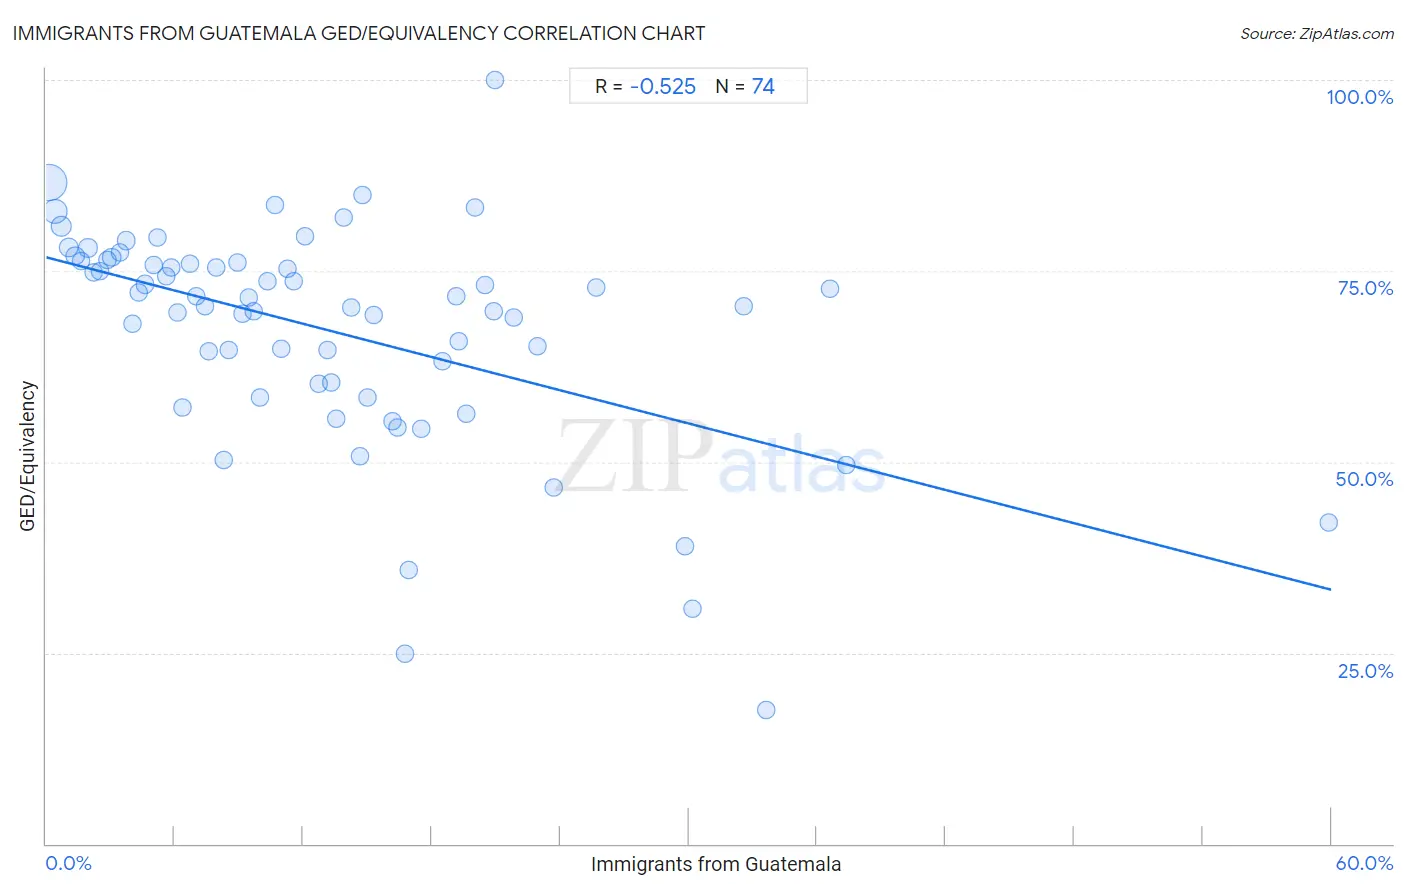
Immigrants from Guatemala GED/Equivalency Correlation Chart
The statistical analysis conducted on geographies consisting of 377,286,142 people shows a substantial negative correlation between the proportion of Immigrants from Guatemala and percentage of population with at least ged/equivalency education in the United States with a correlation coefficient (R) of -0.525 and weighted average of 77.9%. On average, for every 1% (one percent) increase in Immigrants from Guatemala within a typical geography, there is a decrease of 0.73% in percentage of population with at least ged/equivalency education.
It is essential to understand that the correlation between the percentage of Immigrants from Guatemala and percentage of population with at least ged/equivalency education does not imply a direct cause-and-effect relationship. It remains uncertain whether the presence of Immigrants from Guatemala influences an upward or downward trend in the level of percentage of population with at least ged/equivalency education within an area, or if Immigrants from Guatemala simply ended up residing in those areas with higher or lower levels of percentage of population with at least ged/equivalency education due to other factors.
Demographics Similar to Immigrants from Guatemala by GED/Equivalency
In terms of ged/equivalency, the demographic groups most similar to Immigrants from Guatemala are Immigrants from Yemen (77.9%, a difference of 0.020%), Immigrants from Dominican Republic (78.0%, a difference of 0.090%), Immigrants from El Salvador (77.6%, a difference of 0.38%), Tohono O'odham (77.5%, a difference of 0.54%), and Mexican (77.4%, a difference of 0.63%).
| Demographics | Rating | Rank | GED/Equivalency |
| Immigrants from Honduras | 0.0 /100 | #331 | Tragic 78.7% |
| Immigrants from the Azores | 0.0 /100 | #332 | Tragic 78.7% |
| Salvadorans | 0.0 /100 | #333 | Tragic 78.6% |
| Guatemalans | 0.0 /100 | #334 | Tragic 78.5% |
| Immigrants from Latin America | 0.0 /100 | #335 | Tragic 78.5% |
| Immigrants from Dominican Republic | 0.0 /100 | #336 | Tragic 78.0% |
| Immigrants from Yemen | 0.0 /100 | #337 | Tragic 77.9% |
| Immigrants from Guatemala | 0.0 /100 | #338 | Tragic 77.9% |
| Immigrants from El Salvador | 0.0 /100 | #339 | Tragic 77.6% |
| Tohono O'odham | 0.0 /100 | #340 | Tragic 77.5% |
| Mexicans | 0.0 /100 | #341 | Tragic 77.4% |
| Pima | 0.0 /100 | #342 | Tragic 76.4% |
| Immigrants from Central America | 0.0 /100 | #343 | Tragic 76.4% |
| Spanish American Indians | 0.0 /100 | #344 | Tragic 76.3% |
| Immigrants from Mexico | 0.0 /100 | #345 | Tragic 75.7% |
Immigrants from Guatemala GED/Equivalency Correlation Summary
| Measurement | Immigrants from Guatemala Data | GED/Equivalency Data |
| Minimum | 0.12% | 17.4% |
| Maximum | 59.9% | 100.0% |
| Range | 59.8% | 82.6% |
| Mean | 13.2% | 67.2% |
| Median | 11.1% | 71.0% |
| Interquartile 25% (IQ1) | 5.6% | 60.2% |
| Interquartile 75% (IQ3) | 18.5% | 76.1% |
| Interquartile Range (IQR) | 12.9% | 15.9% |
| Standard Deviation (Sample) | 10.5% | 14.6% |
| Standard Deviation (Population) | 10.5% | 14.5% |
Correlation Details
| Immigrants from Guatemala Percentile | Sample Size | GED/Equivalency |
[ 0.0% - 0.5% ] 0.12% | 223,975,574 | 86.6% |
[ 0.0% - 0.5% ] 0.42% | 70,692,042 | 82.8% |
[ 0.5% - 1.0% ] 0.72% | 29,066,536 | 80.9% |
[ 1.0% - 1.5% ] 1.03% | 16,122,316 | 78.1% |
[ 1.0% - 1.5% ] 1.34% | 9,904,224 | 77.0% |
[ 1.5% - 2.0% ] 1.64% | 5,038,661 | 76.3% |
[ 1.5% - 2.0% ] 1.95% | 3,753,850 | 78.0% |
[ 2.0% - 2.5% ] 2.23% | 2,826,370 | 74.8% |
[ 2.5% - 3.0% ] 2.53% | 1,371,707 | 75.0% |
[ 2.5% - 3.0% ] 2.84% | 1,977,585 | 76.4% |
[ 3.0% - 3.5% ] 3.06% | 4,687,256 | 76.8% |
[ 3.0% - 3.5% ] 3.44% | 791,617 | 77.4% |
[ 3.5% - 4.0% ] 3.74% | 928,393 | 79.0% |
[ 4.0% - 4.5% ] 4.01% | 490,768 | 68.1% |
[ 4.0% - 4.5% ] 4.30% | 380,862 | 72.2% |
[ 4.5% - 5.0% ] 4.62% | 948,973 | 73.2% |
[ 4.5% - 5.0% ] 4.99% | 264,008 | 75.7% |
[ 5.0% - 5.5% ] 5.22% | 372,619 | 79.5% |
[ 5.5% - 6.0% ] 5.58% | 410,285 | 74.3% |
[ 5.5% - 6.0% ] 5.81% | 235,955 | 75.5% |
[ 6.0% - 6.5% ] 6.11% | 618,009 | 69.5% |
[ 6.0% - 6.5% ] 6.38% | 257,432 | 57.1% |
[ 6.5% - 7.0% ] 6.72% | 369,428 | 76.0% |
[ 7.0% - 7.5% ] 7.01% | 189,945 | 71.7% |
[ 7.0% - 7.5% ] 7.40% | 127,864 | 70.4% |
[ 7.5% - 8.0% ] 7.61% | 352,969 | 64.5% |
[ 7.5% - 8.0% ] 7.94% | 130,957 | 75.4% |
[ 8.0% - 8.5% ] 8.31% | 1,937 | 50.3% |
[ 8.5% - 9.0% ] 8.52% | 94,498 | 64.6% |
[ 8.5% - 9.0% ] 8.90% | 59,746 | 76.1% |
[ 9.0% - 9.5% ] 9.19% | 40,398 | 69.3% |
[ 9.0% - 9.5% ] 9.46% | 31,748 | 71.5% |
[ 9.5% - 10.0% ] 9.66% | 154,605 | 69.7% |
[ 10.0% - 10.5% ] 10.01% | 62,743 | 58.5% |
[ 10.0% - 10.5% ] 10.35% | 74,296 | 73.6% |
[ 10.5% - 11.0% ] 10.66% | 47,943 | 83.7% |
[ 10.5% - 11.0% ] 10.99% | 8,854 | 64.9% |
[ 11.0% - 11.5% ] 11.24% | 2,892 | 75.3% |
[ 11.5% - 12.0% ] 11.56% | 21,512 | 73.7% |
[ 12.0% - 12.5% ] 12.08% | 1,622 | 79.5% |
[ 12.5% - 13.0% ] 12.71% | 11,184 | 60.2% |
[ 13.0% - 13.5% ] 13.13% | 11,363 | 64.7% |
[ 13.0% - 13.5% ] 13.31% | 64,350 | 60.5% |
[ 13.5% - 14.0% ] 13.57% | 2,115 | 55.6% |
[ 13.5% - 14.0% ] 13.90% | 331 | 82.1% |
[ 14.0% - 14.5% ] 14.23% | 42,230 | 70.2% |
[ 14.5% - 15.0% ] 14.64% | 9,827 | 50.7% |
[ 14.5% - 15.0% ] 14.79% | 7,973 | 84.9% |
[ 14.5% - 15.0% ] 14.98% | 43,649 | 58.4% |
[ 15.0% - 15.5% ] 15.30% | 36,578 | 69.2% |
[ 16.0% - 16.5% ] 16.16% | 51,792 | 55.4% |
[ 16.0% - 16.5% ] 16.40% | 4,085 | 54.5% |
[ 16.5% - 17.0% ] 16.73% | 3,055 | 24.9% |
[ 16.5% - 17.0% ] 16.91% | 6,488 | 35.9% |
[ 17.5% - 18.0% ] 17.53% | 9,320 | 54.3% |
[ 18.5% - 19.0% ] 18.51% | 1,275 | 63.2% |
[ 19.0% - 19.5% ] 19.14% | 2,189 | 71.7% |
[ 19.0% - 19.5% ] 19.25% | 3,538 | 65.9% |
[ 19.5% - 20.0% ] 19.59% | 47,142 | 56.3% |
[ 20.0% - 20.5% ] 20.00% | 50 | 83.3% |
[ 20.0% - 20.5% ] 20.50% | 2,205 | 73.1% |
[ 20.5% - 21.0% ] 20.92% | 7,247 | 69.8% |
[ 20.5% - 21.0% ] 20.97% | 267 | 100.0% |
[ 21.5% - 22.0% ] 21.82% | 559 | 69.0% |
[ 22.5% - 23.0% ] 22.97% | 1,389 | 65.1% |
[ 23.5% - 24.0% ] 23.70% | 211 | 46.7% |
[ 25.5% - 26.0% ] 25.70% | 2,506 | 72.8% |
[ 29.5% - 30.0% ] 29.81% | 21,778 | 38.9% |
[ 30.0% - 30.5% ] 30.20% | 149 | 30.8% |
[ 32.5% - 33.0% ] 32.56% | 129 | 70.4% |
[ 33.5% - 34.0% ] 33.61% | 244 | 17.4% |
[ 36.5% - 37.0% ] 36.61% | 631 | 72.7% |
[ 37.0% - 37.5% ] 37.36% | 182 | 49.5% |
[ 59.5% - 60.0% ] 59.89% | 1,112 | 42.1% |