Immigrants from Guatemala 1 or more Vehicles in Household
COMPARE
Immigrants from Guatemala
Select to Compare
1 or more Vehicles in Household
Immigrants from Guatemala 1 or more Vehicles in Household
88.9%
1+ VEHICLES AVAILABLE
8.6/ 100
METRIC RATING
219th/ 347
METRIC RANK
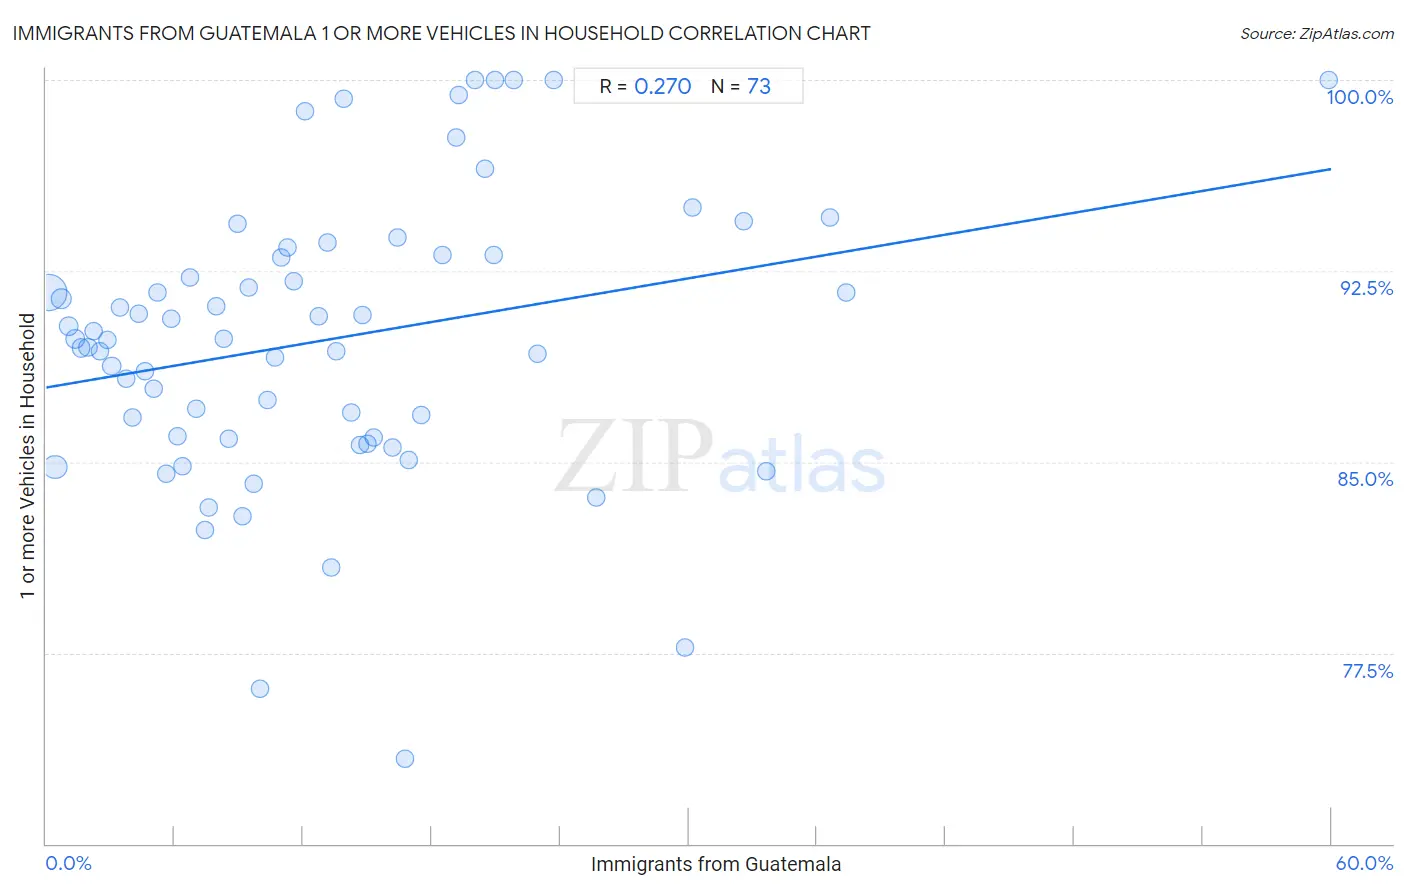
Immigrants from Guatemala 1 or more Vehicles in Household Correlation Chart
The statistical analysis conducted on geographies consisting of 377,136,668 people shows a weak positive correlation between the proportion of Immigrants from Guatemala and percentage of households with 1 or more vehicles available in the United States with a correlation coefficient (R) of 0.270 and weighted average of 88.9%. On average, for every 1% (one percent) increase in Immigrants from Guatemala within a typical geography, there is an increase of 0.14% in percentage of households with 1 or more vehicles available.
It is essential to understand that the correlation between the percentage of Immigrants from Guatemala and percentage of households with 1 or more vehicles available does not imply a direct cause-and-effect relationship. It remains uncertain whether the presence of Immigrants from Guatemala influences an upward or downward trend in the level of percentage of households with 1 or more vehicles available within an area, or if Immigrants from Guatemala simply ended up residing in those areas with higher or lower levels of percentage of households with 1 or more vehicles available due to other factors.
Demographics Similar to Immigrants from Guatemala by 1 or more Vehicles in Household
In terms of 1 or more vehicles in household, the demographic groups most similar to Immigrants from Guatemala are Ugandan (88.9%, a difference of 0.0%), Argentinean (88.9%, a difference of 0.010%), Immigrants from Zaire (88.8%, a difference of 0.030%), Immigrants from Argentina (88.9%, a difference of 0.040%), and Peruvian (88.8%, a difference of 0.040%).
| Demographics | Rating | Rank | 1 or more Vehicles in Household |
| Somalis | 12.8 /100 | #212 | Poor 89.0% |
| Immigrants from Western Asia | 12.3 /100 | #213 | Poor 89.0% |
| Immigrants from Hungary | 11.9 /100 | #214 | Poor 89.0% |
| Immigrants from Sri Lanka | 10.2 /100 | #215 | Poor 88.9% |
| Immigrants from Argentina | 9.4 /100 | #216 | Tragic 88.9% |
| Argentineans | 8.8 /100 | #217 | Tragic 88.9% |
| Ugandans | 8.7 /100 | #218 | Tragic 88.9% |
| Immigrants from Guatemala | 8.6 /100 | #219 | Tragic 88.9% |
| Immigrants from Zaire | 8.1 /100 | #220 | Tragic 88.8% |
| Peruvians | 7.9 /100 | #221 | Tragic 88.8% |
| Uruguayans | 7.0 /100 | #222 | Tragic 88.8% |
| Immigrants from South America | 7.0 /100 | #223 | Tragic 88.8% |
| Immigrants from Hong Kong | 6.2 /100 | #224 | Tragic 88.7% |
| Cree | 6.0 /100 | #225 | Tragic 88.7% |
| Cheyenne | 5.7 /100 | #226 | Tragic 88.7% |
Immigrants from Guatemala 1 or more Vehicles in Household Correlation Summary
| Measurement | Immigrants from Guatemala Data | 1 or more Vehicles in Household Data |
| Minimum | 0.12% | 73.4% |
| Maximum | 59.9% | 100.0% |
| Range | 59.8% | 26.6% |
| Mean | 13.1% | 89.8% |
| Median | 11.0% | 89.8% |
| Interquartile 25% (IQ1) | 5.4% | 85.9% |
| Interquartile 75% (IQ3) | 18.0% | 93.1% |
| Interquartile Range (IQR) | 12.6% | 7.2% |
| Standard Deviation (Sample) | 10.6% | 5.6% |
| Standard Deviation (Population) | 10.5% | 5.6% |
Correlation Details
| Immigrants from Guatemala Percentile | Sample Size | 1 or more Vehicles in Household |
[ 0.0% - 0.5% ] 0.12% | 223,906,672 | 91.7% |
[ 0.0% - 0.5% ] 0.42% | 70,673,570 | 84.8% |
[ 0.5% - 1.0% ] 0.72% | 29,059,746 | 91.4% |
[ 1.0% - 1.5% ] 1.03% | 16,120,558 | 90.3% |
[ 1.0% - 1.5% ] 1.34% | 9,904,224 | 89.8% |
[ 1.5% - 2.0% ] 1.64% | 5,036,985 | 89.5% |
[ 1.5% - 2.0% ] 1.95% | 3,750,239 | 89.5% |
[ 2.0% - 2.5% ] 2.23% | 2,825,632 | 90.1% |
[ 2.5% - 3.0% ] 2.53% | 1,371,707 | 89.3% |
[ 2.5% - 3.0% ] 2.84% | 1,977,585 | 89.8% |
[ 3.0% - 3.5% ] 3.06% | 4,687,256 | 88.8% |
[ 3.0% - 3.5% ] 3.44% | 791,617 | 91.1% |
[ 3.5% - 4.0% ] 3.74% | 928,393 | 88.3% |
[ 4.0% - 4.5% ] 4.01% | 490,768 | 86.8% |
[ 4.0% - 4.5% ] 4.30% | 380,862 | 90.8% |
[ 4.5% - 5.0% ] 4.62% | 948,973 | 88.5% |
[ 4.5% - 5.0% ] 4.99% | 264,008 | 87.9% |
[ 5.0% - 5.5% ] 5.22% | 372,619 | 91.6% |
[ 5.5% - 6.0% ] 5.58% | 410,285 | 84.5% |
[ 5.5% - 6.0% ] 5.81% | 235,955 | 90.6% |
[ 6.0% - 6.5% ] 6.11% | 618,009 | 86.0% |
[ 6.0% - 6.5% ] 6.38% | 257,432 | 84.8% |
[ 6.5% - 7.0% ] 6.72% | 369,428 | 92.2% |
[ 7.0% - 7.5% ] 7.01% | 189,945 | 87.1% |
[ 7.0% - 7.5% ] 7.40% | 127,864 | 82.3% |
[ 7.5% - 8.0% ] 7.61% | 352,969 | 83.2% |
[ 7.5% - 8.0% ] 7.94% | 130,957 | 91.1% |
[ 8.0% - 8.5% ] 8.31% | 1,937 | 89.8% |
[ 8.5% - 9.0% ] 8.52% | 94,498 | 85.9% |
[ 8.5% - 9.0% ] 8.90% | 59,632 | 94.4% |
[ 9.0% - 9.5% ] 9.19% | 40,398 | 82.9% |
[ 9.0% - 9.5% ] 9.46% | 31,748 | 91.9% |
[ 9.5% - 10.0% ] 9.66% | 154,334 | 84.1% |
[ 10.0% - 10.5% ] 10.01% | 62,743 | 76.1% |
[ 10.0% - 10.5% ] 10.35% | 74,296 | 87.4% |
[ 10.5% - 11.0% ] 10.66% | 47,943 | 89.1% |
[ 10.5% - 11.0% ] 10.99% | 8,854 | 93.0% |
[ 11.0% - 11.5% ] 11.24% | 2,892 | 93.4% |
[ 11.5% - 12.0% ] 11.56% | 21,512 | 92.1% |
[ 12.0% - 12.5% ] 12.08% | 1,622 | 98.8% |
[ 12.5% - 13.0% ] 12.71% | 11,184 | 90.7% |
[ 13.0% - 13.5% ] 13.13% | 11,363 | 93.6% |
[ 13.0% - 13.5% ] 13.31% | 64,350 | 80.9% |
[ 13.5% - 14.0% ] 13.57% | 2,115 | 89.3% |
[ 13.5% - 14.0% ] 13.90% | 331 | 99.3% |
[ 14.0% - 14.5% ] 14.23% | 42,230 | 86.9% |
[ 14.5% - 15.0% ] 14.64% | 9,827 | 85.7% |
[ 14.5% - 15.0% ] 14.79% | 7,973 | 90.8% |
[ 14.5% - 15.0% ] 14.98% | 43,649 | 85.7% |
[ 15.0% - 15.5% ] 15.30% | 36,578 | 86.0% |
[ 16.0% - 16.5% ] 16.16% | 51,792 | 85.6% |
[ 16.0% - 16.5% ] 16.40% | 4,085 | 93.8% |
[ 16.5% - 17.0% ] 16.73% | 3,055 | 73.4% |
[ 16.5% - 17.0% ] 16.91% | 6,488 | 85.1% |
[ 17.5% - 18.0% ] 17.53% | 9,320 | 86.9% |
[ 18.5% - 19.0% ] 18.51% | 1,275 | 93.1% |
[ 19.0% - 19.5% ] 19.14% | 2,189 | 97.7% |
[ 19.0% - 19.5% ] 19.25% | 3,538 | 99.4% |
[ 20.0% - 20.5% ] 20.00% | 50 | 100.0% |
[ 20.0% - 20.5% ] 20.50% | 2,205 | 96.5% |
[ 20.5% - 21.0% ] 20.92% | 7,247 | 93.1% |
[ 20.5% - 21.0% ] 20.97% | 267 | 100.0% |
[ 21.5% - 22.0% ] 21.82% | 559 | 100.0% |
[ 22.5% - 23.0% ] 22.97% | 1,389 | 89.3% |
[ 23.5% - 24.0% ] 23.70% | 211 | 100.0% |
[ 25.5% - 26.0% ] 25.70% | 2,506 | 83.6% |
[ 29.5% - 30.0% ] 29.81% | 21,778 | 77.7% |
[ 30.0% - 30.5% ] 30.20% | 149 | 95.0% |
[ 32.5% - 33.0% ] 32.56% | 129 | 94.4% |
[ 33.5% - 34.0% ] 33.61% | 244 | 84.6% |
[ 36.5% - 37.0% ] 36.61% | 631 | 94.6% |
[ 37.0% - 37.5% ] 37.36% | 182 | 91.7% |
[ 59.5% - 60.0% ] 59.89% | 1,112 | 100.0% |