Immigrants from Guatemala Self-Care Disability
COMPARE
Immigrants from Guatemala
Select to Compare
Self-Care Disability
Immigrants from Guatemala Self-Care Disability
2.6%
SELF-CARE DISABILITY
2.2/ 100
METRIC RATING
231st/ 347
METRIC RANK
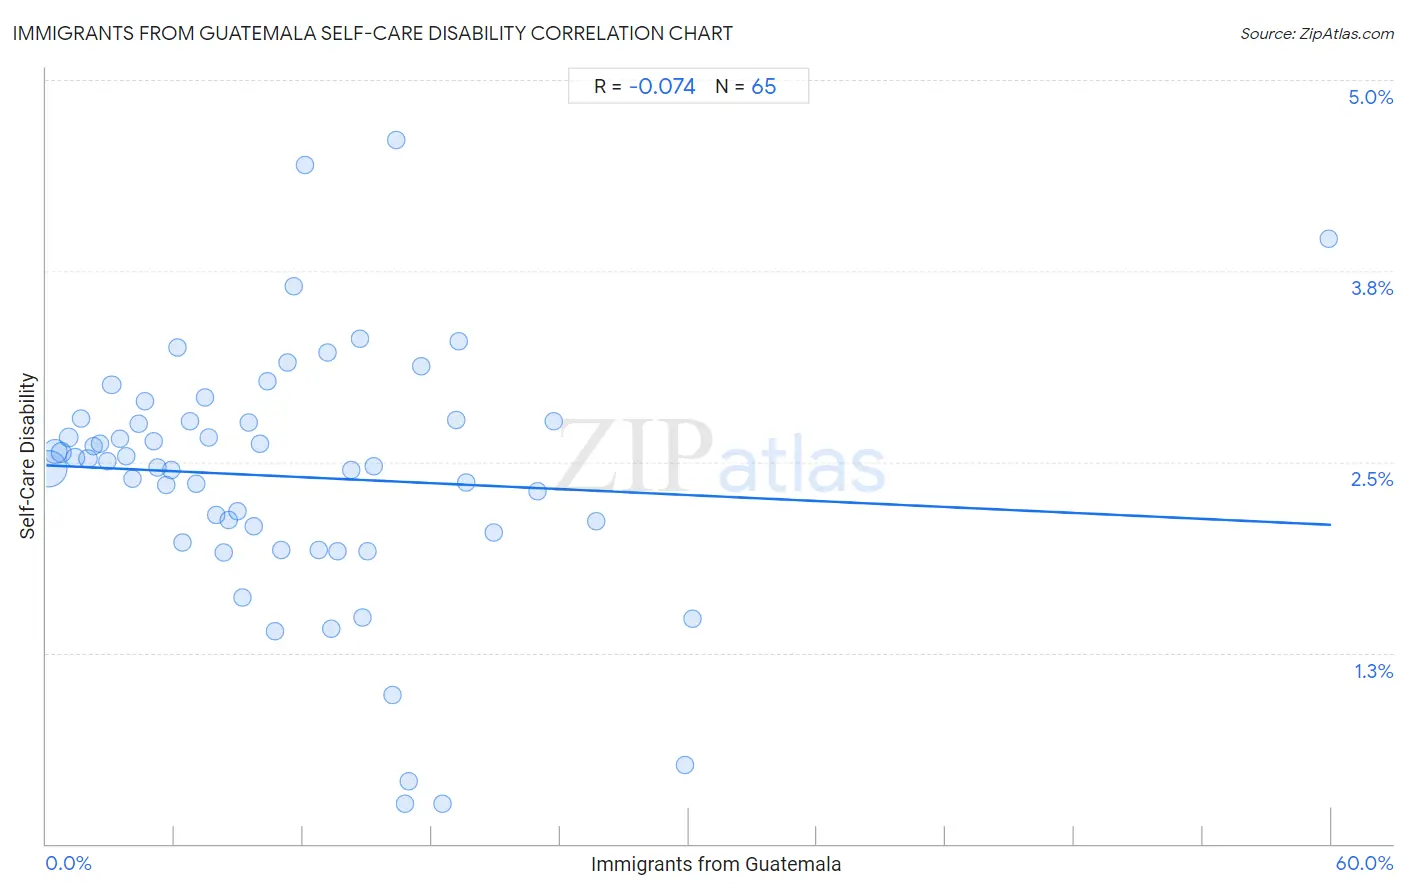
Immigrants from Guatemala Self-Care Disability Correlation Chart
The statistical analysis conducted on geographies consisting of 376,972,339 people shows a slight negative correlation between the proportion of Immigrants from Guatemala and percentage of population with self-care disability in the United States with a correlation coefficient (R) of -0.074 and weighted average of 2.6%. On average, for every 1% (one percent) increase in Immigrants from Guatemala within a typical geography, there is a decrease of 0.0065% in percentage of population with self-care disability.
It is essential to understand that the correlation between the percentage of Immigrants from Guatemala and percentage of population with self-care disability does not imply a direct cause-and-effect relationship. It remains uncertain whether the presence of Immigrants from Guatemala influences an upward or downward trend in the level of percentage of population with self-care disability within an area, or if Immigrants from Guatemala simply ended up residing in those areas with higher or lower levels of percentage of population with self-care disability due to other factors.
Demographics Similar to Immigrants from Guatemala by Self-Care Disability
In terms of self-care disability, the demographic groups most similar to Immigrants from Guatemala are Albanian (2.6%, a difference of 0.030%), Liberian (2.6%, a difference of 0.070%), Vietnamese (2.6%, a difference of 0.070%), Bahamian (2.6%, a difference of 0.11%), and Guamanian/Chamorro (2.6%, a difference of 0.15%).
| Demographics | Rating | Rank | Self-Care Disability |
| Osage | 3.6 /100 | #224 | Tragic 2.6% |
| Iraqis | 3.2 /100 | #225 | Tragic 2.6% |
| Chinese | 2.9 /100 | #226 | Tragic 2.6% |
| Immigrants from Philippines | 2.7 /100 | #227 | Tragic 2.6% |
| Guatemalans | 2.7 /100 | #228 | Tragic 2.6% |
| Guamanians/Chamorros | 2.5 /100 | #229 | Tragic 2.6% |
| Immigrants from Ecuador | 2.5 /100 | #230 | Tragic 2.6% |
| Immigrants from Guatemala | 2.2 /100 | #231 | Tragic 2.6% |
| Albanians | 2.2 /100 | #232 | Tragic 2.6% |
| Liberians | 2.1 /100 | #233 | Tragic 2.6% |
| Vietnamese | 2.1 /100 | #234 | Tragic 2.6% |
| Bahamians | 2.0 /100 | #235 | Tragic 2.6% |
| Bermudans | 1.9 /100 | #236 | Tragic 2.6% |
| Immigrants from Senegal | 1.6 /100 | #237 | Tragic 2.6% |
| Senegalese | 1.3 /100 | #238 | Tragic 2.6% |
Immigrants from Guatemala Self-Care Disability Correlation Summary
| Measurement | Immigrants from Guatemala Data | Self-Care Disability Data |
| Minimum | 0.12% | 0.26% |
| Maximum | 59.9% | 4.6% |
| Range | 59.8% | 4.3% |
| Mean | 11.4% | 2.4% |
| Median | 9.7% | 2.5% |
| Interquartile 25% (IQ1) | 4.8% | 2.0% |
| Interquartile 75% (IQ3) | 15.7% | 2.8% |
| Interquartile Range (IQR) | 10.9% | 0.77% |
| Standard Deviation (Sample) | 9.5% | 0.84% |
| Standard Deviation (Population) | 9.4% | 0.83% |
Correlation Details
| Immigrants from Guatemala Percentile | Sample Size | Self-Care Disability |
[ 0.0% - 0.5% ] 0.12% | 223,841,906 | 2.5% |
[ 0.0% - 0.5% ] 0.42% | 70,642,739 | 2.6% |
[ 0.5% - 1.0% ] 0.72% | 29,045,876 | 2.6% |
[ 1.0% - 1.5% ] 1.02% | 16,103,149 | 2.7% |
[ 1.0% - 1.5% ] 1.34% | 9,893,548 | 2.5% |
[ 1.5% - 2.0% ] 1.64% | 5,033,691 | 2.8% |
[ 1.5% - 2.0% ] 1.95% | 3,739,445 | 2.5% |
[ 2.0% - 2.5% ] 2.23% | 2,823,446 | 2.6% |
[ 2.5% - 3.0% ] 2.53% | 1,363,706 | 2.6% |
[ 2.5% - 3.0% ] 2.84% | 1,972,941 | 2.5% |
[ 3.0% - 3.5% ] 3.06% | 4,684,622 | 3.0% |
[ 3.0% - 3.5% ] 3.44% | 790,630 | 2.7% |
[ 3.5% - 4.0% ] 3.74% | 925,571 | 2.5% |
[ 4.0% - 4.5% ] 4.01% | 490,465 | 2.4% |
[ 4.0% - 4.5% ] 4.30% | 380,163 | 2.8% |
[ 4.5% - 5.0% ] 4.62% | 947,596 | 2.9% |
[ 4.5% - 5.0% ] 5.00% | 250,749 | 2.6% |
[ 5.0% - 5.5% ] 5.22% | 370,817 | 2.5% |
[ 5.5% - 6.0% ] 5.58% | 409,655 | 2.4% |
[ 5.5% - 6.0% ] 5.81% | 235,955 | 2.4% |
[ 6.0% - 6.5% ] 6.11% | 616,571 | 3.2% |
[ 6.0% - 6.5% ] 6.38% | 257,432 | 2.0% |
[ 6.5% - 7.0% ] 6.72% | 369,428 | 2.8% |
[ 7.0% - 7.5% ] 7.01% | 187,073 | 2.4% |
[ 7.0% - 7.5% ] 7.40% | 127,864 | 2.9% |
[ 7.5% - 8.0% ] 7.61% | 351,742 | 2.7% |
[ 7.5% - 8.0% ] 7.94% | 130,957 | 2.2% |
[ 8.0% - 8.5% ] 8.31% | 1,937 | 1.9% |
[ 8.5% - 9.0% ] 8.51% | 93,246 | 2.1% |
[ 8.5% - 9.0% ] 8.90% | 59,346 | 2.2% |
[ 9.0% - 9.5% ] 9.19% | 40,398 | 1.6% |
[ 9.0% - 9.5% ] 9.46% | 31,748 | 2.8% |
[ 9.5% - 10.0% ] 9.66% | 154,334 | 2.1% |
[ 10.0% - 10.5% ] 10.01% | 61,114 | 2.6% |
[ 10.0% - 10.5% ] 10.35% | 74,296 | 3.0% |
[ 10.5% - 11.0% ] 10.66% | 47,070 | 1.4% |
[ 10.5% - 11.0% ] 10.99% | 8,854 | 1.9% |
[ 11.0% - 11.5% ] 11.24% | 2,670 | 3.2% |
[ 11.5% - 12.0% ] 11.56% | 21,512 | 3.6% |
[ 12.0% - 12.5% ] 12.08% | 1,622 | 4.4% |
[ 12.5% - 13.0% ] 12.71% | 11,184 | 1.9% |
[ 13.0% - 13.5% ] 13.14% | 10,171 | 3.2% |
[ 13.0% - 13.5% ] 13.31% | 64,350 | 1.4% |
[ 13.5% - 14.0% ] 13.59% | 1,354 | 1.9% |
[ 14.0% - 14.5% ] 14.23% | 42,230 | 2.4% |
[ 14.5% - 15.0% ] 14.64% | 9,827 | 3.3% |
[ 14.5% - 15.0% ] 14.79% | 7,905 | 1.5% |
[ 14.5% - 15.0% ] 14.98% | 43,649 | 1.9% |
[ 15.0% - 15.5% ] 15.30% | 36,578 | 2.5% |
[ 16.0% - 16.5% ] 16.16% | 51,761 | 0.98% |
[ 16.0% - 16.5% ] 16.37% | 2,389 | 4.6% |
[ 16.5% - 17.0% ] 16.73% | 3,055 | 0.26% |
[ 16.5% - 17.0% ] 16.94% | 4,492 | 0.41% |
[ 17.5% - 18.0% ] 17.53% | 9,320 | 3.1% |
[ 18.5% - 19.0% ] 18.51% | 1,275 | 0.26% |
[ 19.0% - 19.5% ] 19.15% | 1,843 | 2.8% |
[ 19.0% - 19.5% ] 19.25% | 3,538 | 3.3% |
[ 19.5% - 20.0% ] 19.59% | 47,142 | 2.4% |
[ 20.5% - 21.0% ] 20.92% | 7,247 | 2.0% |
[ 22.5% - 23.0% ] 22.97% | 1,389 | 2.3% |
[ 23.5% - 24.0% ] 23.70% | 211 | 2.8% |
[ 25.5% - 26.0% ] 25.70% | 2,506 | 2.1% |
[ 29.5% - 30.0% ] 29.81% | 21,778 | 0.52% |
[ 30.0% - 30.5% ] 30.20% | 149 | 1.5% |
[ 59.5% - 60.0% ] 59.89% | 1,112 | 4.0% |