Immigrants from Grenada Married-Couple Family Poverty

COMPARE

Immigrants from Grenada
Race
Ancestry
AfghanAfricanAlaska NativeAlaskan AthabascanAlbanianAleutAlsatianAmericanApacheArabArapahoArgentineanArmenianAssyrian/Chaldean/SyriacAustralianAustrianBahamianBangladeshiBarbadianBasqueBelgianBelizeanBermudanBhutaneseBlackfeetBolivianBrazilianBritishBritish West IndianBulgarianBurmeseCajunCambodianCanadianCape VerdeanCarpatho RusynCelticCentral AmericanCentral American IndianCherokeeCheyenneChickasawChileanChineseChippewaChoctawColombianColvilleComancheCosta RicanCreeCreekCroatianCrowCubanCypriotCzechCzechoslovakianDanishDelawareDominicanDutchDutch West IndianEastern EuropeanEcuadorianEgyptianEnglishEstonianEthiopianEuropeanFijianFilipinoFinnishFrenchFrench American IndianFrench CanadianGermanGerman RussianGhanaianGreekGuamanian/ChamorroGuatemalanGuyaneseHaitianHmongHonduranHopiHoumaHungarianIcelanderIndian (Asian)IndonesianInupiatIranianIraqiIrishIroquoisIsraeliItalianJamaicanJapaneseJordanianKenyanKiowaKoreanLaotianLatvianLebaneseLiberianLithuanianLumbeeLuxembourgerMacedonianMalaysianMalteseMarshalleseMenomineeMexicanMexican American IndianMongolianMoroccanNative HawaiianNavajoNepaleseNew ZealanderNicaraguanNigerianNorthern EuropeanNorwegianOkinawanOsageOttawaPaiutePakistaniPalestinianPanamanianParaguayanPennsylvania GermanPeruvianPimaPolishPortuguesePotawatomiPuebloPuerto RicanPuget Sound SalishRomanianRussianSalvadoranSamoanScandinavianScotch-IrishScottishSeminoleSenegaleseSerbianShoshoneSierra LeoneanSiouxSlavicSlovakSloveneSomaliSouth AfricanSouth AmericanSouth American IndianSoviet UnionSpaniardSpanishSpanish AmericanSpanish American IndianSri LankanSubsaharan AfricanSudaneseSwedishSwissSyrianTaiwaneseThaiTlingit-HaidaTohono O'OdhamTonganTrinidadian and TobagonianTsimshianTurkishU.S. Virgin IslanderUgandanUkrainianUruguayanUteVenezuelanVietnameseWelshWest IndianYakamaYaquiYugoslavianYumanYup'ikZimbabwean
Immigration
NonimmigrantsImmigrantsAfghanistanAfricaAlbaniaArgentinaArmeniaAsiaAustraliaAustriaBahamasBangladeshBarbadosBelarusBelgiumBelizeBoliviaBosnia and HerzegovinaBrazilBulgariaBurma/MyanmarCabo VerdeCambodiaCameroonCanadaCaribbeanCentral AmericaChileChinaColombiaCongoCosta RicaCroatiaCubaCzechoslovakiaDenmarkDominicaDominican RepublicEastern AfricaEastern AsiaEastern EuropeEcuadorEgyptEl SalvadorEnglandEritreaEthiopiaEuropeFijiFranceGermanyGhanaGreeceGrenadaGuatemalaGuyanaHaitiHondurasHong KongHungaryIndiaIndonesiaIranIraqIrelandIsraelItalyJamaicaJapanJordanKazakhstanKenyaKoreaKuwaitLaosLatin AmericaLatviaLebanonLiberiaLithuaniaMalaysiaMexicoMicronesiaMiddle AfricaMoldovaMoroccoNepalNetherlandsNicaraguaNigeriaNorth AmericaNorth MacedoniaNorthern AfricaNorthern EuropeNorwayOceaniaPakistanPanamaPeruPhilippinesPolandPortugalRomaniaRussiaSaudi ArabiaScotlandSenegalSerbiaSierra LeoneSingaporeSomaliaSouth AfricaSouth AmericaSouth Central AsiaSouth Eastern AsiaSouthern EuropeSpainSri LankaSt. Vincent and the GrenadinesSudanSwedenSwitzerlandSyriaTaiwanThailandTrinidad and TobagoTurkeyUgandaUkraineUruguayUzbekistanVenezuelaVietnamWest IndiesWestern AfricaWestern AsiaWestern EuropeYemenZaireZimbabweAzores
Select to Compare
Race
Ancestry
AfghanAfricanAlaska NativeAlaskan AthabascanAlbanianAleutAlsatianAmericanApacheArabArapahoArgentineanArmenianAssyrian/Chaldean/SyriacAustralianAustrianBahamianBangladeshiBarbadianBasqueBelgianBelizeanBermudanBhutaneseBlackfeetBolivianBrazilianBritishBritish West IndianBulgarianBurmeseCajunCambodianCanadianCape VerdeanCarpatho RusynCelticCentral AmericanCentral American IndianCherokeeCheyenneChickasawChileanChineseChippewaChoctawColombianColvilleComancheCosta RicanCreeCreekCroatianCrowCubanCypriotCzechCzechoslovakianDanishDelawareDominicanDutchDutch West IndianEastern EuropeanEcuadorianEgyptianEnglishEstonianEthiopianEuropeanFijianFilipinoFinnishFrenchFrench American IndianFrench CanadianGermanGerman RussianGhanaianGreekGuamanian/ChamorroGuatemalanGuyaneseHaitianHmongHonduranHopiHoumaHungarianIcelanderIndian (Asian)IndonesianInupiatIranianIraqiIrishIroquoisIsraeliItalianJamaicanJapaneseJordanianKenyanKiowaKoreanLaotianLatvianLebaneseLiberianLithuanianLumbeeLuxembourgerMacedonianMalaysianMalteseMarshalleseMenomineeMexicanMexican American IndianMongolianMoroccanNative HawaiianNavajoNepaleseNew ZealanderNicaraguanNigerianNorthern EuropeanNorwegianOkinawanOsageOttawaPaiutePakistaniPalestinianPanamanianParaguayanPennsylvania GermanPeruvianPimaPolishPortuguesePotawatomiPuebloPuerto RicanPuget Sound SalishRomanianRussianSalvadoranSamoanScandinavianScotch-IrishScottishSeminoleSenegaleseSerbianShoshoneSierra LeoneanSiouxSlavicSlovakSloveneSomaliSouth AfricanSouth AmericanSouth American IndianSoviet UnionSpaniardSpanishSpanish AmericanSpanish American IndianSri LankanSubsaharan AfricanSudaneseSwedishSwissSyrianTaiwaneseThaiTlingit-HaidaTohono O'OdhamTonganTrinidadian and TobagonianTsimshianTurkishU.S. Virgin IslanderUgandanUkrainianUruguayanUteVenezuelanVietnameseWelshWest IndianYakamaYaquiYugoslavianYumanYup'ikZimbabwean
Immigration
NonimmigrantsImmigrantsAfghanistanAfricaAlbaniaArgentinaArmeniaAsiaAustraliaAustriaBahamasBangladeshBarbadosBelarusBelgiumBelizeBoliviaBosnia and HerzegovinaBrazilBulgariaBurma/MyanmarCabo VerdeCambodiaCameroonCanadaCaribbeanCentral AmericaChileChinaColombiaCongoCosta RicaCroatiaCubaCzechoslovakiaDenmarkDominicaDominican RepublicEastern AfricaEastern AsiaEastern EuropeEcuadorEgyptEl SalvadorEnglandEritreaEthiopiaEuropeFijiFranceGermanyGhanaGreeceGuatemalaGuyanaHaitiHondurasHong KongHungaryIndiaIndonesiaIranIraqIrelandIsraelItalyJamaicaJapanJordanKazakhstanKenyaKoreaKuwaitLaosLatin AmericaLatviaLebanonLiberiaLithuaniaMalaysiaMexicoMicronesiaMiddle AfricaMoldovaMoroccoNepalNetherlandsNicaraguaNigeriaNorth AmericaNorth MacedoniaNorthern AfricaNorthern EuropeNorwayOceaniaPakistanPanamaPeruPhilippinesPolandPortugalRomaniaRussiaSaudi ArabiaScotlandSenegalSerbiaSierra LeoneSingaporeSomaliaSouth AfricaSouth AmericaSouth Central AsiaSouth Eastern AsiaSouthern EuropeSpainSri LankaSt. Vincent and the GrenadinesSudanSwedenSwitzerlandSyriaTaiwanThailandTrinidad and TobagoTurkeyUgandaUkraineUruguayUzbekistanVenezuelaVietnamWest IndiesWestern AfricaWestern AsiaWestern EuropeYemenZaireZimbabweAzores
Married-Couple Family Poverty
Income
Poverty
Unemployment
Labor Participation
Family Structure
Vehicle Availability
Education Level
Disability

Immigrants from Grenada Married-Couple Family Poverty
Tragic

7.3%
POVERTY | MARRIED-COUPLE FAMILIES
0.0/ 100
METRIC RATING
320th/ 347
METRIC RANK

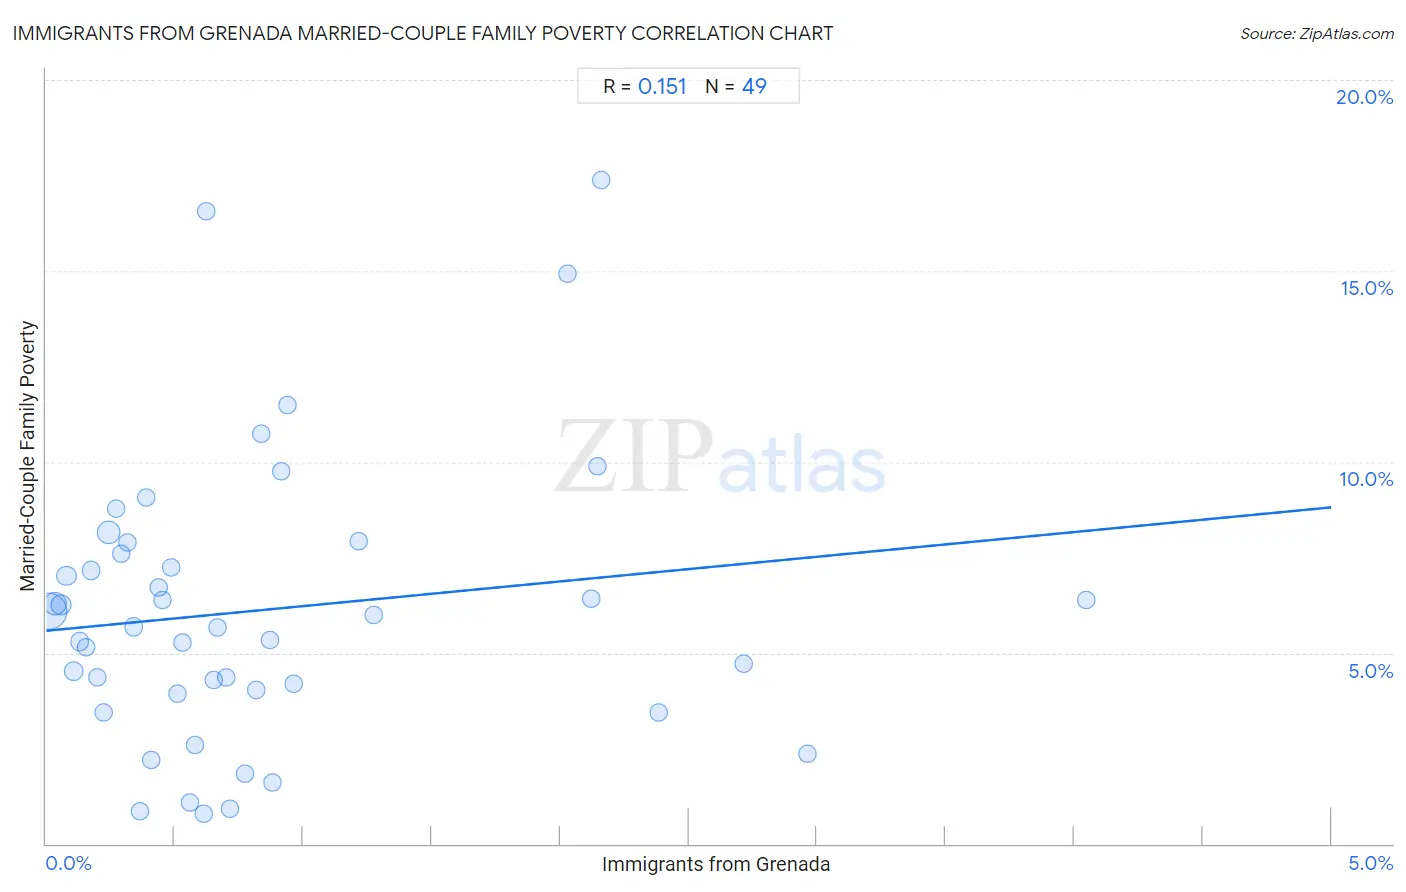
Immigrants from Grenada Married-Couple Family Poverty Correlation Chart

The statistical analysis conducted on geographies consisting of 67,074,791 people shows a poor positive correlation between the proportion of Immigrants from Grenada and poverty level among married-couple families in the United States with a correlation coefficient (R) of 0.151 and weighted average of 7.3%. On average, for every 1% (one percent) increase in Immigrants from Grenada within a typical geography, there is an increase of 0.65% in poverty level among married-couple families.
Immigrants from Grenada Married-Couple Family Poverty
It is essential to understand that the correlation between the percentage of Immigrants from Grenada and poverty level among married-couple families does not imply a direct cause-and-effect relationship. It remains uncertain whether the presence of Immigrants from Grenada influences an upward or downward trend in the level of poverty level among married-couple families within an area, or if Immigrants from Grenada simply ended up residing in those areas with higher or lower levels of poverty level among married-couple families due to other factors.

Demographics Similar to Immigrants from Grenada by Married-Couple Family Poverty

In terms of married-couple family poverty, the demographic groups most similar to Immigrants from Grenada are Immigrants from Caribbean (7.3%, a difference of 0.77%), Immigrants from Honduras (7.3%, a difference of 0.79%), Immigrants from Latin America (7.2%, a difference of 1.2%), Immigrants from Guatemala (7.2%, a difference of 1.4%), and Mexican (7.2%, a difference of 1.5%).
DemographicsRating | RankMarried-Couple Family Poverty
Immigrants from St. Vincent and the Grenadines
0.0
/100
|
#313
Tragic
7.1%
British West Indians
0.0
/100
|
#314
Tragic
7.1%
Inupiat
0.0
/100
|
#315
Tragic
7.1%
Hondurans
0.0
/100
|
#316
Tragic
7.2%
Mexicans
0.0
/100
|
#317
Tragic
7.2%
Immigrants from Guatemala
0.0
/100
|
#318
Tragic
7.2%
Immigrants from Latin America
0.0
/100
|
#319
Tragic
7.2%
Immigrants from Grenada
0.0
/100
|
#320
Tragic
7.3%
Immigrants from Caribbean
0.0
/100
|
#321
Tragic
7.3%
Immigrants from Honduras
0.0
/100
|
#322
Tragic
7.3%
Vietnamese
0.0
/100
|
#323
Tragic
7.4%
Immigrants from Central America
0.0
/100
|
#324
Tragic
7.4%
Immigrants from Cuba
0.0
/100
|
#325
Tragic
7.5%
Immigrants from Bangladesh
0.0
/100
|
#326
Tragic
7.5%
Hispanics or Latinos
0.0
/100
|
#327
Tragic
7.5%

Immigrants from Grenada Married-Couple Family Poverty Correlation Summary

MeasurementImmigrants from Grenada DataMarried-Couple Family Poverty Data
Minimum0.0078%0.79%
Maximum4.0%17.4%
Range4.0%16.6%
Mean0.84%6.1%
Median0.58%5.7%
Interquartile 25% (IQ1)0.28%4.0%
Interquartile 75% (IQ3)0.93%7.7%
Interquartile Range (IQR)0.64%3.8%
Standard Deviation (Sample)0.87%3.7%
Standard Deviation (Population)0.86%3.7%

Correlation Details

Immigrants from Grenada PercentileSample SizeMarried-Couple Family Poverty
[
0.0%
-
0.5%
]
0.0078%
32,465,1866.1%
[
0.0%
-
0.5%
]
0.035%
8,810,5286.3%
[
0.0%
-
0.5%
]
0.056%
4,892,9716.2%
[
0.0%
-
0.5%
]
0.079%
3,611,5837.0%
[
0.0%
-
0.5%
]
0.11%
2,383,9334.5%
[
0.0%
-
0.5%
]
0.13%
1,100,5025.3%
[
0.0%
-
0.5%
]
0.15%
722,5085.1%
[
0.0%
-
0.5%
]
0.17%
532,7897.2%
[
0.0%
-
0.5%
]
0.20%
441,5474.3%
[
0.0%
-
0.5%
]
0.22%
291,4413.4%
[
0.0%
-
0.5%
]
0.24%
8,948,9288.2%
[
0.0%
-
0.5%
]
0.27%
471,7538.8%
[
0.0%
-
0.5%
]
0.29%
103,0397.6%
[
0.0%
-
0.5%
]
0.32%
179,9697.9%
[
0.0%
-
0.5%
]
0.34%
157,0515.7%
[
0.0%
-
0.5%
]
0.36%
29,8850.84%
[
0.0%
-
0.5%
]
0.39%
35,3589.1%
[
0.0%
-
0.5%
]
0.41%
64,0282.2%
[
0.0%
-
0.5%
]
0.44%
194,4486.7%
[
0.0%
-
0.5%
]
0.45%
7,5156.4%
[
0.0%
-
0.5%
]
0.49%
108,3027.2%
[
0.5%
-
1.0%
]
0.51%
117,7213.9%
[
0.5%
-
1.0%
]
0.53%
14,7535.3%
[
0.5%
-
1.0%
]
0.56%
5371.1%
[
0.5%
-
1.0%
]
0.58%
18,0142.6%
[
0.5%
-
1.0%
]
0.61%
9,6300.79%
[
0.5%
-
1.0%
]
0.62%
56,57216.5%
[
0.5%
-
1.0%
]
0.65%
59,7044.3%
[
0.5%
-
1.0%
]
0.67%
55,5395.7%
[
0.5%
-
1.0%
]
0.70%
110,9414.4%
[
0.5%
-
1.0%
]
0.71%
8,2620.91%
[
0.5%
-
1.0%
]
0.77%
44,8321.8%
[
0.5%
-
1.0%
]
0.82%
89,3684.0%
[
0.5%
-
1.0%
]
0.84%
134,66710.7%
[
0.5%
-
1.0%
]
0.87%
92,3485.3%
[
0.5%
-
1.0%
]
0.88%
23,2441.6%
[
0.5%
-
1.0%
]
0.91%
7,2249.7%
[
0.5%
-
1.0%
]
0.94%
1,49011.5%
[
0.5%
-
1.0%
]
0.96%
4,6664.2%
[
1.0%
-
1.5%
]
1.22%
83,1257.9%
[
1.0%
-
1.5%
]
1.27%
89,9766.0%
[
2.0%
-
2.5%
]
2.03%
69,13114.9%
[
2.0%
-
2.5%
]
2.12%
101,0536.4%
[
2.0%
-
2.5%
]
2.15%
58,4769.9%
[
2.0%
-
2.5%
]
2.16%
84,00617.4%
[
2.0%
-
2.5%
]
2.38%
100,0823.4%
[
2.5%
-
3.0%
]
2.71%
1,2164.7%
[
2.5%
-
3.0%
]
2.96%
6,4442.4%
[
4.0%
-
4.5%
]
4.05%
78,5066.4%