Immigrants from Grenada Self-Care Disability

COMPARE

Immigrants from Grenada
Race
Ancestry
AfghanAfricanAlaska NativeAlaskan AthabascanAlbanianAleutAlsatianAmericanApacheArabArapahoArgentineanArmenianAssyrian/Chaldean/SyriacAustralianAustrianBahamianBangladeshiBarbadianBasqueBelgianBelizeanBermudanBhutaneseBlackfeetBolivianBrazilianBritishBritish West IndianBulgarianBurmeseCajunCambodianCanadianCape VerdeanCarpatho RusynCelticCentral AmericanCentral American IndianCherokeeCheyenneChickasawChileanChineseChippewaChoctawColombianColvilleComancheCosta RicanCreeCreekCroatianCrowCubanCypriotCzechCzechoslovakianDanishDelawareDominicanDutchDutch West IndianEastern EuropeanEcuadorianEgyptianEnglishEstonianEthiopianEuropeanFijianFilipinoFinnishFrenchFrench American IndianFrench CanadianGermanGerman RussianGhanaianGreekGuamanian/ChamorroGuatemalanGuyaneseHaitianHmongHonduranHopiHoumaHungarianIcelanderIndian (Asian)IndonesianInupiatIranianIraqiIrishIroquoisIsraeliItalianJamaicanJapaneseJordanianKenyanKiowaKoreanLaotianLatvianLebaneseLiberianLithuanianLumbeeLuxembourgerMacedonianMalaysianMalteseMarshalleseMenomineeMexicanMexican American IndianMongolianMoroccanNative HawaiianNavajoNepaleseNew ZealanderNicaraguanNigerianNorthern EuropeanNorwegianOkinawanOsageOttawaPaiutePakistaniPalestinianPanamanianParaguayanPennsylvania GermanPeruvianPimaPolishPortuguesePotawatomiPuebloPuerto RicanPuget Sound SalishRomanianRussianSalvadoranSamoanScandinavianScotch-IrishScottishSeminoleSenegaleseSerbianShoshoneSierra LeoneanSiouxSlavicSlovakSloveneSomaliSouth AfricanSouth AmericanSouth American IndianSoviet UnionSpaniardSpanishSpanish AmericanSpanish American IndianSri LankanSubsaharan AfricanSudaneseSwedishSwissSyrianTaiwaneseThaiTlingit-HaidaTohono O'OdhamTonganTrinidadian and TobagonianTsimshianTurkishU.S. Virgin IslanderUgandanUkrainianUruguayanUteVenezuelanVietnameseWelshWest IndianYakamaYaquiYugoslavianYumanYup'ikZimbabwean
Immigration
NonimmigrantsImmigrantsAfghanistanAfricaAlbaniaArgentinaArmeniaAsiaAustraliaAustriaBahamasBangladeshBarbadosBelarusBelgiumBelizeBoliviaBosnia and HerzegovinaBrazilBulgariaBurma/MyanmarCabo VerdeCambodiaCameroonCanadaCaribbeanCentral AmericaChileChinaColombiaCongoCosta RicaCroatiaCubaCzechoslovakiaDenmarkDominicaDominican RepublicEastern AfricaEastern AsiaEastern EuropeEcuadorEgyptEl SalvadorEnglandEritreaEthiopiaEuropeFijiFranceGermanyGhanaGreeceGrenadaGuatemalaGuyanaHaitiHondurasHong KongHungaryIndiaIndonesiaIranIraqIrelandIsraelItalyJamaicaJapanJordanKazakhstanKenyaKoreaKuwaitLaosLatin AmericaLatviaLebanonLiberiaLithuaniaMalaysiaMexicoMicronesiaMiddle AfricaMoldovaMoroccoNepalNetherlandsNicaraguaNigeriaNorth AmericaNorth MacedoniaNorthern AfricaNorthern EuropeNorwayOceaniaPakistanPanamaPeruPhilippinesPolandPortugalRomaniaRussiaSaudi ArabiaScotlandSenegalSerbiaSierra LeoneSingaporeSomaliaSouth AfricaSouth AmericaSouth Central AsiaSouth Eastern AsiaSouthern EuropeSpainSri LankaSt. Vincent and the GrenadinesSudanSwedenSwitzerlandSyriaTaiwanThailandTrinidad and TobagoTurkeyUgandaUkraineUruguayUzbekistanVenezuelaVietnamWest IndiesWestern AfricaWestern AsiaWestern EuropeYemenZaireZimbabweAzores
Select to Compare
Race
Ancestry
AfghanAfricanAlaska NativeAlaskan AthabascanAlbanianAleutAlsatianAmericanApacheArabArapahoArgentineanArmenianAssyrian/Chaldean/SyriacAustralianAustrianBahamianBangladeshiBarbadianBasqueBelgianBelizeanBermudanBhutaneseBlackfeetBolivianBrazilianBritishBritish West IndianBulgarianBurmeseCajunCambodianCanadianCape VerdeanCarpatho RusynCelticCentral AmericanCentral American IndianCherokeeCheyenneChickasawChileanChineseChippewaChoctawColombianColvilleComancheCosta RicanCreeCreekCroatianCrowCubanCypriotCzechCzechoslovakianDanishDelawareDominicanDutchDutch West IndianEastern EuropeanEcuadorianEgyptianEnglishEstonianEthiopianEuropeanFijianFilipinoFinnishFrenchFrench American IndianFrench CanadianGermanGerman RussianGhanaianGreekGuamanian/ChamorroGuatemalanGuyaneseHaitianHmongHonduranHopiHoumaHungarianIcelanderIndian (Asian)IndonesianInupiatIranianIraqiIrishIroquoisIsraeliItalianJamaicanJapaneseJordanianKenyanKiowaKoreanLaotianLatvianLebaneseLiberianLithuanianLumbeeLuxembourgerMacedonianMalaysianMalteseMarshalleseMenomineeMexicanMexican American IndianMongolianMoroccanNative HawaiianNavajoNepaleseNew ZealanderNicaraguanNigerianNorthern EuropeanNorwegianOkinawanOsageOttawaPaiutePakistaniPalestinianPanamanianParaguayanPennsylvania GermanPeruvianPimaPolishPortuguesePotawatomiPuebloPuerto RicanPuget Sound SalishRomanianRussianSalvadoranSamoanScandinavianScotch-IrishScottishSeminoleSenegaleseSerbianShoshoneSierra LeoneanSiouxSlavicSlovakSloveneSomaliSouth AfricanSouth AmericanSouth American IndianSoviet UnionSpaniardSpanishSpanish AmericanSpanish American IndianSri LankanSubsaharan AfricanSudaneseSwedishSwissSyrianTaiwaneseThaiTlingit-HaidaTohono O'OdhamTonganTrinidadian and TobagonianTsimshianTurkishU.S. Virgin IslanderUgandanUkrainianUruguayanUteVenezuelanVietnameseWelshWest IndianYakamaYaquiYugoslavianYumanYup'ikZimbabwean
Immigration
NonimmigrantsImmigrantsAfghanistanAfricaAlbaniaArgentinaArmeniaAsiaAustraliaAustriaBahamasBangladeshBarbadosBelarusBelgiumBelizeBoliviaBosnia and HerzegovinaBrazilBulgariaBurma/MyanmarCabo VerdeCambodiaCameroonCanadaCaribbeanCentral AmericaChileChinaColombiaCongoCosta RicaCroatiaCubaCzechoslovakiaDenmarkDominicaDominican RepublicEastern AfricaEastern AsiaEastern EuropeEcuadorEgyptEl SalvadorEnglandEritreaEthiopiaEuropeFijiFranceGermanyGhanaGreeceGuatemalaGuyanaHaitiHondurasHong KongHungaryIndiaIndonesiaIranIraqIrelandIsraelItalyJamaicaJapanJordanKazakhstanKenyaKoreaKuwaitLaosLatin AmericaLatviaLebanonLiberiaLithuaniaMalaysiaMexicoMicronesiaMiddle AfricaMoldovaMoroccoNepalNetherlandsNicaraguaNigeriaNorth AmericaNorth MacedoniaNorthern AfricaNorthern EuropeNorwayOceaniaPakistanPanamaPeruPhilippinesPolandPortugalRomaniaRussiaSaudi ArabiaScotlandSenegalSerbiaSierra LeoneSingaporeSomaliaSouth AfricaSouth AmericaSouth Central AsiaSouth Eastern AsiaSouthern EuropeSpainSri LankaSt. Vincent and the GrenadinesSudanSwedenSwitzerlandSyriaTaiwanThailandTrinidad and TobagoTurkeyUgandaUkraineUruguayUzbekistanVenezuelaVietnamWest IndiesWestern AfricaWestern AsiaWestern EuropeYemenZaireZimbabweAzores
Self-Care Disability
Income
Poverty
Unemployment
Labor Participation
Family Structure
Vehicle Availability
Education Level
Disability

Immigrants from Grenada Self-Care Disability
Tragic

2.8%
SELF-CARE DISABILITY
0.0/ 100
METRIC RATING
308th/ 347
METRIC RANK

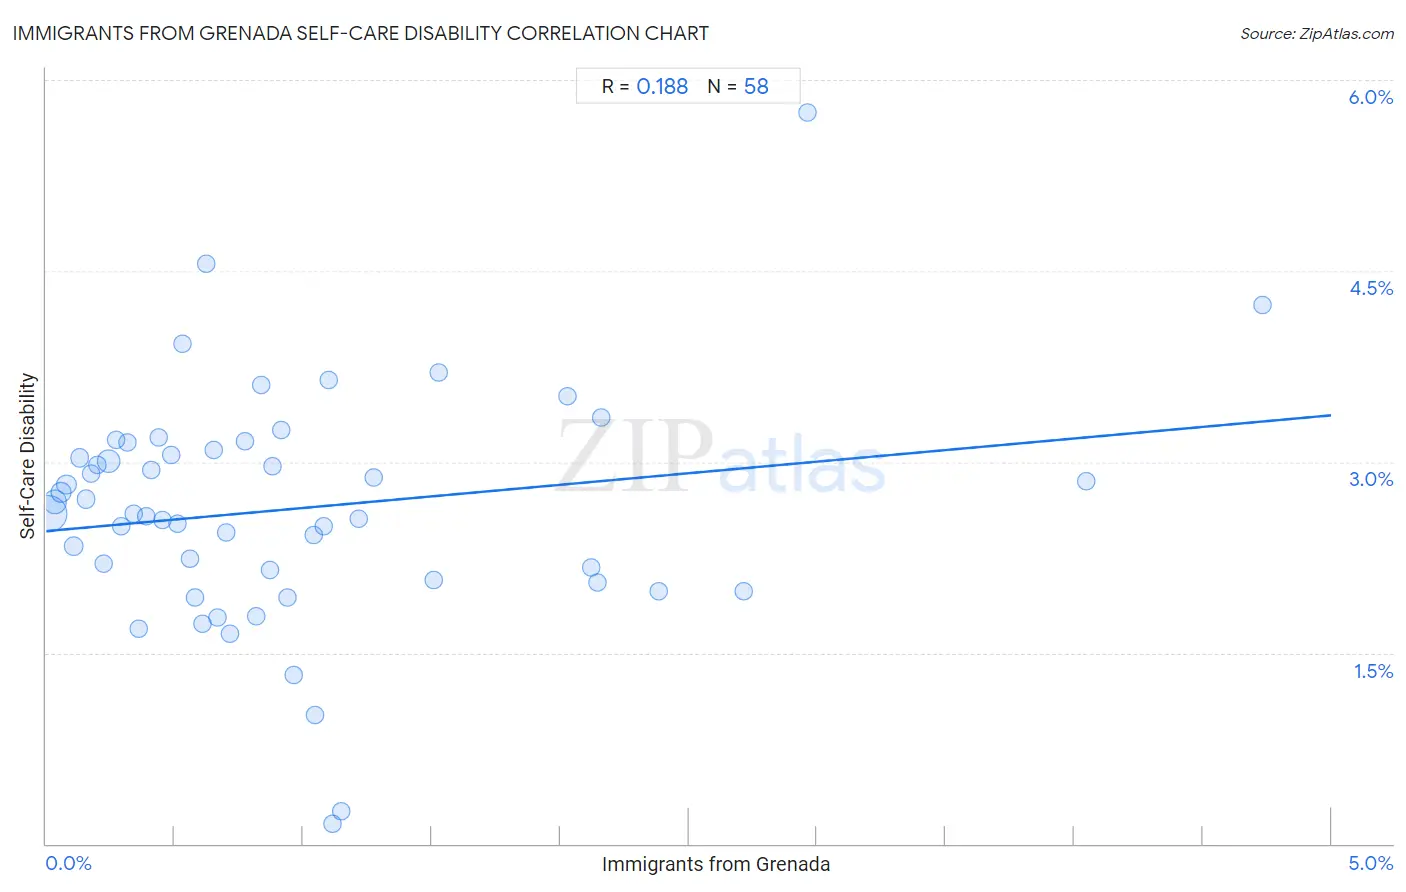
Immigrants from Grenada Self-Care Disability Correlation Chart

The statistical analysis conducted on geographies consisting of 67,173,864 people shows a poor positive correlation between the proportion of Immigrants from Grenada and percentage of population with self-care disability in the United States with a correlation coefficient (R) of 0.188 and weighted average of 2.8%. On average, for every 1% (one percent) increase in Immigrants from Grenada within a typical geography, there is an increase of 0.18% in percentage of population with self-care disability.
Immigrants from Grenada Self-Care Disability
It is essential to understand that the correlation between the percentage of Immigrants from Grenada and percentage of population with self-care disability does not imply a direct cause-and-effect relationship. It remains uncertain whether the presence of Immigrants from Grenada influences an upward or downward trend in the level of percentage of population with self-care disability within an area, or if Immigrants from Grenada simply ended up residing in those areas with higher or lower levels of percentage of population with self-care disability due to other factors.

Demographics Similar to Immigrants from Grenada by Self-Care Disability

In terms of self-care disability, the demographic groups most similar to Immigrants from Grenada are Bangladeshi (2.8%, a difference of 0.15%), British West Indian (2.8%, a difference of 0.25%), Native/Alaskan (2.8%, a difference of 0.30%), Puget Sound Salish (2.8%, a difference of 0.32%), and Aleut (2.8%, a difference of 0.37%).
DemographicsRating | RankSelf-Care Disability
Pima
0.0
/100
|
#301
Tragic
2.8%
Immigrants from St. Vincent and the Grenadines
0.0
/100
|
#302
Tragic
2.8%
Immigrants from Belize
0.0
/100
|
#303
Tragic
2.8%
Cree
0.0
/100
|
#304
Tragic
2.8%
Immigrants from West Indies
0.0
/100
|
#305
Tragic
2.8%
Aleuts
0.0
/100
|
#306
Tragic
2.8%
Natives/Alaskans
0.0
/100
|
#307
Tragic
2.8%
Immigrants from Grenada
0.0
/100
|
#308
Tragic
2.8%
Bangladeshis
0.0
/100
|
#309
Tragic
2.8%
British West Indians
0.0
/100
|
#310
Tragic
2.8%
Puget Sound Salish
0.0
/100
|
#311
Tragic
2.8%
Immigrants from Caribbean
0.0
/100
|
#312
Tragic
2.8%
Spanish Americans
0.0
/100
|
#313
Tragic
2.8%
Creek
0.0
/100
|
#314
Tragic
2.8%
Immigrants from Cuba
0.0
/100
|
#315
Tragic
2.8%

Immigrants from Grenada Self-Care Disability Correlation Summary

MeasurementImmigrants from Grenada DataSelf-Care Disability Data
Minimum0.0078%0.16%
Maximum4.7%5.7%
Range4.7%5.6%
Mean0.96%2.6%
Median0.68%2.6%
Interquartile 25% (IQ1)0.34%2.1%
Interquartile 75% (IQ3)1.1%3.1%
Interquartile Range (IQR)0.77%1.0%
Standard Deviation (Sample)0.95%0.92%
Standard Deviation (Population)0.94%0.92%

Correlation Details

Immigrants from Grenada PercentileSample SizeSelf-Care Disability
[
0.0%
-
0.5%
]
0.0078%
32,465,1862.6%
[
0.0%
-
0.5%
]
0.035%
8,810,5282.7%
[
0.0%
-
0.5%
]
0.056%
4,892,9712.8%
[
0.0%
-
0.5%
]
0.079%
3,622,2182.8%
[
0.0%
-
0.5%
]
0.11%
2,383,9332.3%
[
0.0%
-
0.5%
]
0.13%
1,100,5023.0%
[
0.0%
-
0.5%
]
0.15%
722,5082.7%
[
0.0%
-
0.5%
]
0.17%
537,1642.9%
[
0.0%
-
0.5%
]
0.20%
441,5473.0%
[
0.0%
-
0.5%
]
0.22%
291,4412.2%
[
0.0%
-
0.5%
]
0.24%
8,948,9283.0%
[
0.0%
-
0.5%
]
0.27%
507,5573.2%
[
0.0%
-
0.5%
]
0.29%
103,0392.5%
[
0.0%
-
0.5%
]
0.32%
186,7333.2%
[
0.0%
-
0.5%
]
0.34%
159,0852.6%
[
0.0%
-
0.5%
]
0.36%
20,2831.7%
[
0.0%
-
0.5%
]
0.39%
35,3582.6%
[
0.0%
-
0.5%
]
0.41%
67,0842.9%
[
0.0%
-
0.5%
]
0.44%
194,4483.2%
[
0.0%
-
0.5%
]
0.45%
7,5152.5%
[
0.0%
-
0.5%
]
0.49%
108,3023.1%
[
0.5%
-
1.0%
]
0.51%
120,0432.5%
[
0.5%
-
1.0%
]
0.53%
14,7533.9%
[
0.5%
-
1.0%
]
0.56%
5372.2%
[
0.5%
-
1.0%
]
0.58%
18,0141.9%
[
0.5%
-
1.0%
]
0.61%
19,0861.7%
[
0.5%
-
1.0%
]
0.62%
56,5724.6%
[
0.5%
-
1.0%
]
0.65%
65,5493.1%
[
0.5%
-
1.0%
]
0.67%
55,5391.8%
[
0.5%
-
1.0%
]
0.70%
110,9412.4%
[
0.5%
-
1.0%
]
0.71%
8,2621.6%
[
0.5%
-
1.0%
]
0.77%
44,8323.2%
[
0.5%
-
1.0%
]
0.82%
89,3681.8%
[
0.5%
-
1.0%
]
0.84%
135,7333.6%
[
0.5%
-
1.0%
]
0.87%
92,3482.1%
[
0.5%
-
1.0%
]
0.88%
23,2443.0%
[
0.5%
-
1.0%
]
0.91%
7,2243.3%
[
0.5%
-
1.0%
]
0.94%
1,4901.9%
[
0.5%
-
1.0%
]
0.96%
4,6661.3%
[
1.0%
-
1.5%
]
1.04%
2,1182.4%
[
1.0%
-
1.5%
]
1.04%
7661.0%
[
1.0%
-
1.5%
]
1.08%
1,0202.5%
[
1.0%
-
1.5%
]
1.10%
5,4493.6%
[
1.0%
-
1.5%
]
1.11%
6290.16%
[
1.0%
-
1.5%
]
1.15%
5,8310.26%
[
1.0%
-
1.5%
]
1.22%
83,1252.6%
[
1.0%
-
1.5%
]
1.27%
89,9762.9%
[
1.5%
-
2.0%
]
1.51%
2,9822.1%
[
1.5%
-
2.0%
]
1.53%
1,5723.7%
[
2.0%
-
2.5%
]
2.03%
69,1313.5%
[
2.0%
-
2.5%
]
2.12%
101,0532.2%
[
2.0%
-
2.5%
]
2.15%
63,1652.1%
[
2.0%
-
2.5%
]
2.16%
84,0063.3%
[
2.0%
-
2.5%
]
2.38%
100,0822.0%
[
2.5%
-
3.0%
]
2.71%
1,2162.0%
[
2.5%
-
3.0%
]
2.96%
6,4445.7%
[
4.0%
-
4.5%
]
4.05%
78,5062.9%
[
4.5%
-
5.0%
]
4.73%
2,2624.2%