Immigrants from Grenada Disability Age Under 5
COMPARE
Immigrants from Grenada
Select to Compare
Disability Age Under 5
Immigrants from Grenada Disability Age Under 5
0.94%
DISABILITY | AGE UNDER 5
100.0/ 100
METRIC RATING
12th/ 347
METRIC RANK
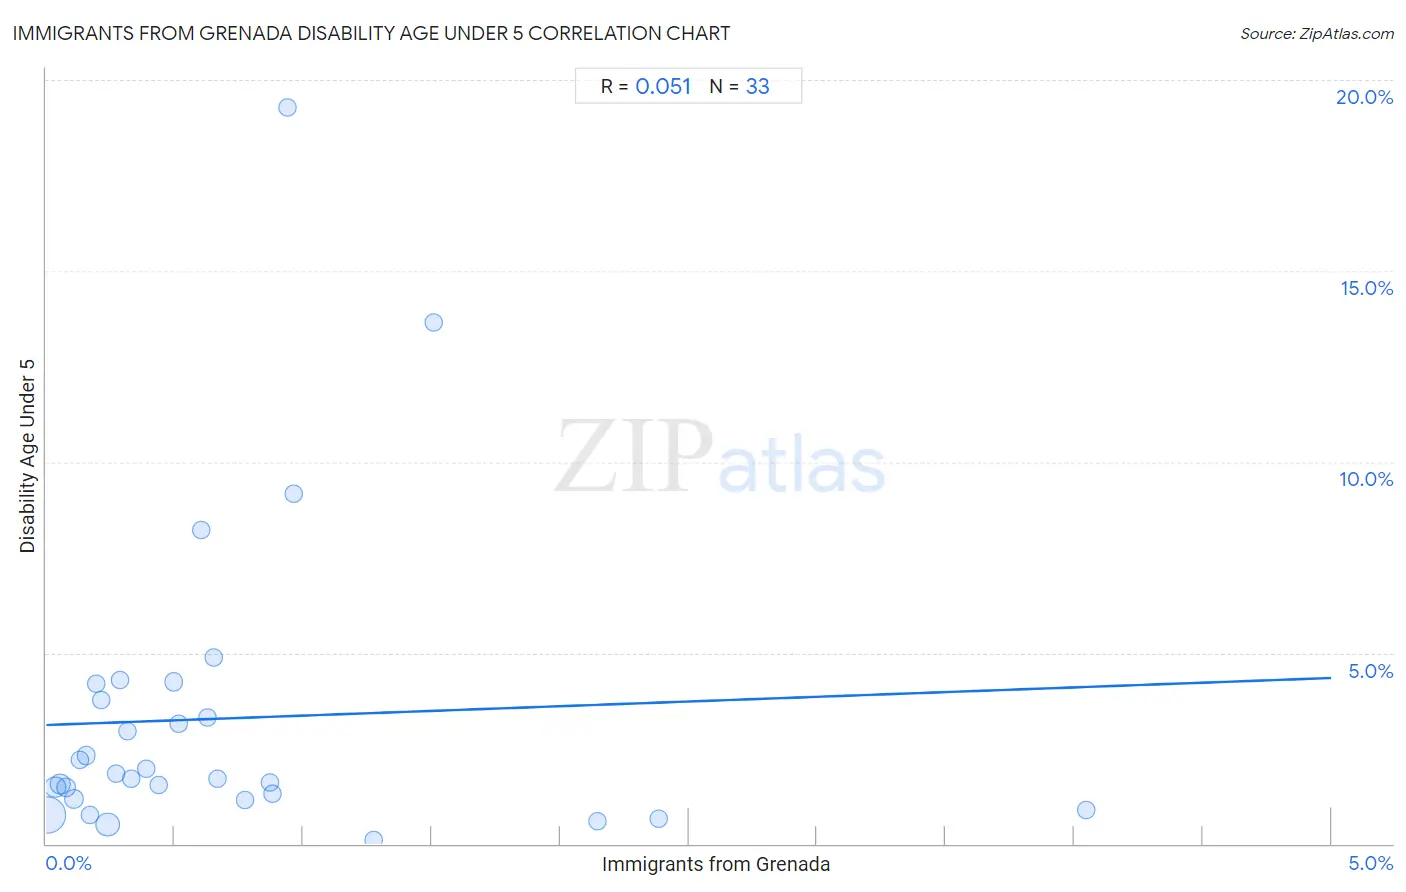
Immigrants from Grenada Disability Age Under 5 Correlation Chart
The statistical analysis conducted on geographies consisting of 49,697,157 people shows a slight positive correlation between the proportion of Immigrants from Grenada and percentage of population with a disability under the age of 5 in the United States with a correlation coefficient (R) of 0.051 and weighted average of 0.94%. On average, for every 1% (one percent) increase in Immigrants from Grenada within a typical geography, there is an increase of 0.25% in percentage of population with a disability under the age of 5.
It is essential to understand that the correlation between the percentage of Immigrants from Grenada and percentage of population with a disability under the age of 5 does not imply a direct cause-and-effect relationship. It remains uncertain whether the presence of Immigrants from Grenada influences an upward or downward trend in the level of percentage of population with a disability under the age of 5 within an area, or if Immigrants from Grenada simply ended up residing in those areas with higher or lower levels of percentage of population with a disability under the age of 5 due to other factors.
Demographics Similar to Immigrants from Grenada by Disability Age Under 5
In terms of disability age under 5, the demographic groups most similar to Immigrants from Grenada are Afghan (0.94%, a difference of 0.020%), Soviet Union (0.95%, a difference of 0.17%), Yuman (0.95%, a difference of 0.24%), Immigrants from Hong Kong (0.95%, a difference of 0.28%), and Marshallese (0.94%, a difference of 0.78%).
| Demographics | Rating | Rank | Disability Age Under 5 |
| Immigrants from Bangladesh | 100.0 /100 | #5 | Exceptional 0.85% |
| Ute | 100.0 /100 | #6 | Exceptional 0.86% |
| Immigrants from Afghanistan | 100.0 /100 | #7 | Exceptional 0.91% |
| Immigrants from Yemen | 100.0 /100 | #8 | Exceptional 0.91% |
| Immigrants from Fiji | 100.0 /100 | #9 | Exceptional 0.92% |
| Marshallese | 100.0 /100 | #10 | Exceptional 0.94% |
| Afghans | 100.0 /100 | #11 | Exceptional 0.94% |
| Immigrants from Grenada | 100.0 /100 | #12 | Exceptional 0.94% |
| Soviet Union | 100.0 /100 | #13 | Exceptional 0.95% |
| Yuman | 100.0 /100 | #14 | Exceptional 0.95% |
| Immigrants from Hong Kong | 100.0 /100 | #15 | Exceptional 0.95% |
| Immigrants from Israel | 100.0 /100 | #16 | Exceptional 0.96% |
| Immigrants from China | 100.0 /100 | #17 | Exceptional 0.96% |
| Immigrants from Barbados | 100.0 /100 | #18 | Exceptional 0.97% |
| Puget Sound Salish | 100.0 /100 | #19 | Exceptional 0.97% |
Immigrants from Grenada Disability Age Under 5 Correlation Summary
| Measurement | Immigrants from Grenada Data | Disability Age Under 5 Data |
| Minimum | 0.0068% | 0.086% |
| Maximum | 4.0% | 19.3% |
| Range | 4.0% | 19.2% |
| Mean | 0.69% | 3.3% |
| Median | 0.44% | 1.7% |
| Interquartile 25% (IQ1) | 0.18% | 1.1% |
| Interquartile 75% (IQ3) | 0.88% | 4.0% |
| Interquartile Range (IQR) | 0.69% | 2.8% |
| Standard Deviation (Sample) | 0.83% | 4.0% |
| Standard Deviation (Population) | 0.81% | 4.0% |
Correlation Details
| Immigrants from Grenada Percentile | Sample Size | Disability Age Under 5 |
[ 0.0% - 0.5% ] 0.0068% | 27,560,977 | 0.76% |
[ 0.0% - 0.5% ] 0.035% | 4,795,974 | 1.5% |
[ 0.0% - 0.5% ] 0.054% | 2,883,208 | 1.6% |
[ 0.0% - 0.5% ] 0.079% | 2,222,795 | 1.5% |
[ 0.0% - 0.5% ] 0.11% | 1,273,048 | 1.2% |
[ 0.0% - 0.5% ] 0.13% | 329,625 | 2.2% |
[ 0.0% - 0.5% ] 0.16% | 206,360 | 2.3% |
[ 0.0% - 0.5% ] 0.17% | 224,781 | 0.76% |
[ 0.0% - 0.5% ] 0.19% | 128,536 | 4.2% |
[ 0.0% - 0.5% ] 0.22% | 31,438 | 3.8% |
[ 0.0% - 0.5% ] 0.24% | 8,688,209 | 0.50% |
[ 0.0% - 0.5% ] 0.27% | 335,979 | 1.8% |
[ 0.0% - 0.5% ] 0.29% | 29,820 | 4.3% |
[ 0.0% - 0.5% ] 0.32% | 109,771 | 2.9% |
[ 0.0% - 0.5% ] 0.33% | 44,818 | 1.7% |
[ 0.0% - 0.5% ] 0.39% | 35,358 | 2.0% |
[ 0.0% - 0.5% ] 0.44% | 107,674 | 1.6% |
[ 0.0% - 0.5% ] 0.49% | 44,729 | 4.2% |
[ 0.5% - 1.0% ] 0.51% | 32,826 | 3.2% |
[ 0.5% - 1.0% ] 0.61% | 991 | 8.2% |
[ 0.5% - 1.0% ] 0.63% | 28,754 | 3.3% |
[ 0.5% - 1.0% ] 0.65% | 29,345 | 4.9% |
[ 0.5% - 1.0% ] 0.67% | 55,539 | 1.7% |
[ 0.5% - 1.0% ] 0.77% | 44,832 | 1.1% |
[ 0.5% - 1.0% ] 0.87% | 92,348 | 1.6% |
[ 0.5% - 1.0% ] 0.88% | 23,244 | 1.3% |
[ 0.5% - 1.0% ] 0.94% | 1,490 | 19.3% |
[ 0.5% - 1.0% ] 0.96% | 4,666 | 9.2% |
[ 1.0% - 1.5% ] 1.27% | 89,976 | 0.086% |
[ 1.5% - 2.0% ] 1.51% | 2,982 | 13.6% |
[ 2.0% - 2.5% ] 2.15% | 58,476 | 0.59% |
[ 2.0% - 2.5% ] 2.38% | 100,082 | 0.65% |
[ 4.0% - 4.5% ] 4.05% | 78,506 | 0.89% |