Immigrants from Grenada 4 or more Vehicles in Household
COMPARE
Immigrants from Grenada
Select to Compare
4 or more Vehicles in Household
Immigrants from Grenada 4 or more Vehicles in Household
2.7%
4+ VEHICLES AVAILABLE
0.0/ 100
METRIC RATING
347th/ 347
METRIC RANK
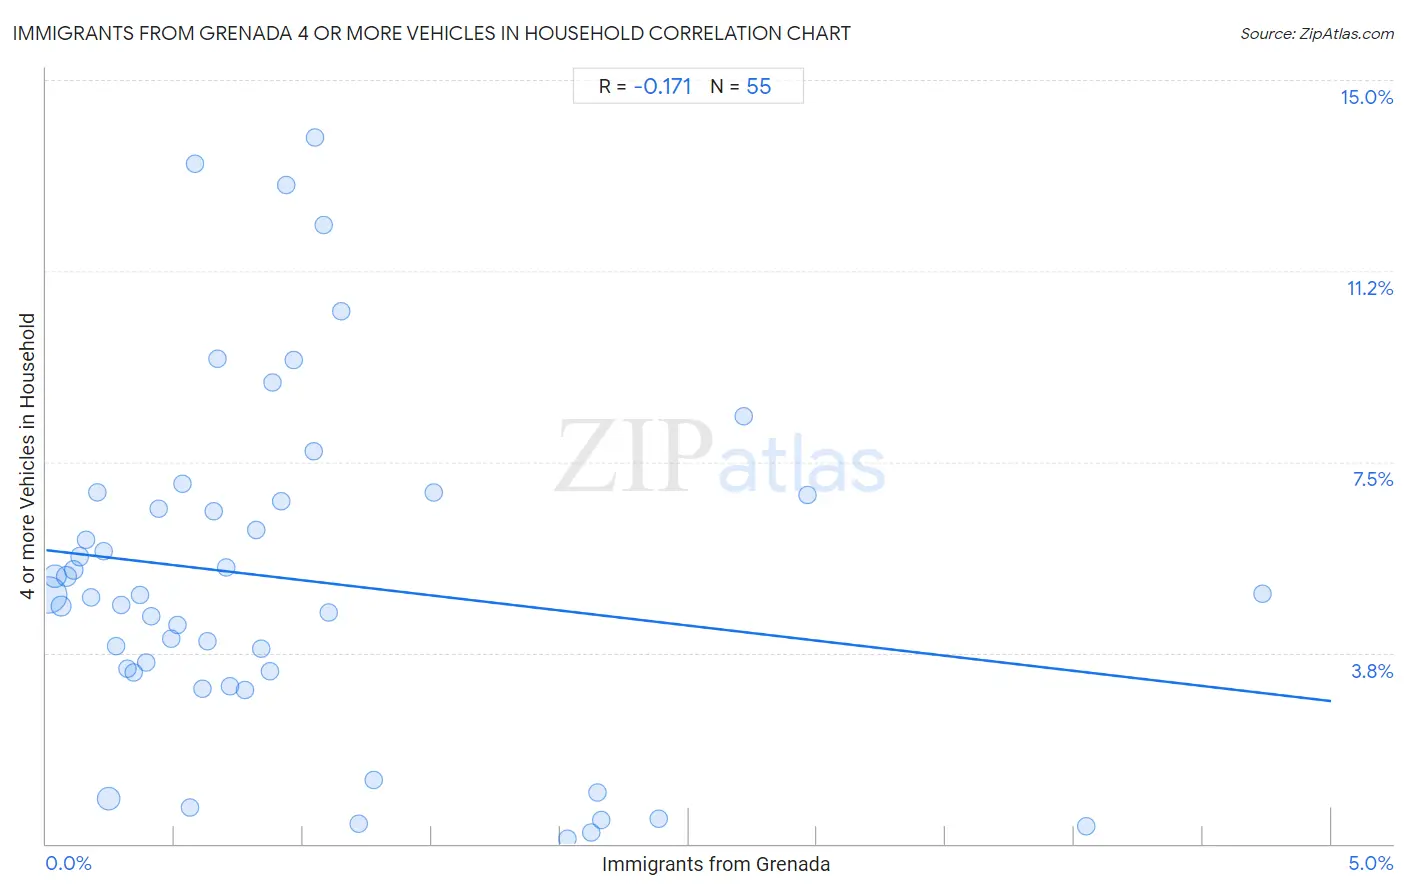
Immigrants from Grenada 4 or more Vehicles in Household Correlation Chart
The statistical analysis conducted on geographies consisting of 66,738,845 people shows a poor negative correlation between the proportion of Immigrants from Grenada and percentage of households with 4 or more vehicles available in the United States with a correlation coefficient (R) of -0.171 and weighted average of 2.7%. On average, for every 1% (one percent) increase in Immigrants from Grenada within a typical geography, there is a decrease of 0.59% in percentage of households with 4 or more vehicles available.
It is essential to understand that the correlation between the percentage of Immigrants from Grenada and percentage of households with 4 or more vehicles available does not imply a direct cause-and-effect relationship. It remains uncertain whether the presence of Immigrants from Grenada influences an upward or downward trend in the level of percentage of households with 4 or more vehicles available within an area, or if Immigrants from Grenada simply ended up residing in those areas with higher or lower levels of percentage of households with 4 or more vehicles available due to other factors.
Demographics Similar to Immigrants from Grenada by 4 or more Vehicles in Household
In terms of 4 or more vehicles in household, the demographic groups most similar to Immigrants from Grenada are Immigrants from St. Vincent and the Grenadines (3.0%, a difference of 8.5%), Immigrants from Dominican Republic (3.3%, a difference of 19.4%), Immigrants from Guyana (3.4%, a difference of 24.2%), British West Indian (3.5%, a difference of 26.2%), and Guyanese (3.5%, a difference of 27.4%).
| Demographics | Rating | Rank | 4 or more Vehicles in Household |
| Immigrants from Albania | 0.0 /100 | #333 | Tragic 4.1% |
| Immigrants from Trinidad and Tobago | 0.0 /100 | #334 | Tragic 4.1% |
| Barbadians | 0.0 /100 | #335 | Tragic 3.9% |
| Immigrants from Bangladesh | 0.0 /100 | #336 | Tragic 3.9% |
| Vietnamese | 0.0 /100 | #337 | Tragic 3.9% |
| Immigrants from Cabo Verde | 0.0 /100 | #338 | Tragic 3.8% |
| Immigrants from Uzbekistan | 0.0 /100 | #339 | Tragic 3.6% |
| Immigrants from Barbados | 0.0 /100 | #340 | Tragic 3.6% |
| Dominicans | 0.0 /100 | #341 | Tragic 3.5% |
| Guyanese | 0.0 /100 | #342 | Tragic 3.5% |
| British West Indians | 0.0 /100 | #343 | Tragic 3.5% |
| Immigrants from Guyana | 0.0 /100 | #344 | Tragic 3.4% |
| Immigrants from Dominican Republic | 0.0 /100 | #345 | Tragic 3.3% |
| Immigrants from St. Vincent and the Grenadines | 0.0 /100 | #346 | Tragic 3.0% |
| Immigrants from Grenada | 0.0 /100 | #347 | Tragic 2.7% |
Immigrants from Grenada 4 or more Vehicles in Household Correlation Summary
| Measurement | Immigrants from Grenada Data | 4 or more Vehicles in Household Data |
| Minimum | 0.0078% | 0.11% |
| Maximum | 4.7% | 13.9% |
| Range | 4.7% | 13.8% |
| Mean | 0.96% | 5.2% |
| Median | 0.67% | 4.9% |
| Interquartile 25% (IQ1) | 0.32% | 3.4% |
| Interquartile 75% (IQ3) | 1.1% | 6.9% |
| Interquartile Range (IQR) | 0.79% | 3.5% |
| Standard Deviation (Sample) | 0.97% | 3.4% |
| Standard Deviation (Population) | 0.96% | 3.3% |
Correlation Details
| Immigrants from Grenada Percentile | Sample Size | 4 or more Vehicles in Household |
[ 0.0% - 0.5% ] 0.0078% | 32,414,867 | 4.9% |
[ 0.0% - 0.5% ] 0.035% | 8,670,420 | 5.3% |
[ 0.0% - 0.5% ] 0.056% | 4,743,993 | 4.7% |
[ 0.0% - 0.5% ] 0.079% | 3,622,218 | 5.2% |
[ 0.0% - 0.5% ] 0.11% | 2,383,933 | 5.4% |
[ 0.0% - 0.5% ] 0.13% | 1,049,191 | 5.6% |
[ 0.0% - 0.5% ] 0.15% | 722,508 | 6.0% |
[ 0.0% - 0.5% ] 0.17% | 537,164 | 4.8% |
[ 0.0% - 0.5% ] 0.20% | 441,547 | 6.9% |
[ 0.0% - 0.5% ] 0.22% | 263,304 | 5.8% |
[ 0.0% - 0.5% ] 0.24% | 8,948,928 | 0.89% |
[ 0.0% - 0.5% ] 0.27% | 507,557 | 3.9% |
[ 0.0% - 0.5% ] 0.29% | 103,039 | 4.7% |
[ 0.0% - 0.5% ] 0.32% | 186,733 | 3.4% |
[ 0.0% - 0.5% ] 0.34% | 159,085 | 3.4% |
[ 0.0% - 0.5% ] 0.36% | 29,885 | 4.9% |
[ 0.0% - 0.5% ] 0.39% | 35,358 | 3.6% |
[ 0.0% - 0.5% ] 0.41% | 67,084 | 4.5% |
[ 0.0% - 0.5% ] 0.44% | 194,448 | 6.6% |
[ 0.0% - 0.5% ] 0.49% | 108,302 | 4.0% |
[ 0.5% - 1.0% ] 0.51% | 120,043 | 4.3% |
[ 0.5% - 1.0% ] 0.53% | 14,753 | 7.1% |
[ 0.5% - 1.0% ] 0.56% | 537 | 0.72% |
[ 0.5% - 1.0% ] 0.58% | 18,014 | 13.4% |
[ 0.5% - 1.0% ] 0.61% | 19,086 | 3.0% |
[ 0.5% - 1.0% ] 0.63% | 39,764 | 4.0% |
[ 0.5% - 1.0% ] 0.65% | 65,549 | 6.5% |
[ 0.5% - 1.0% ] 0.67% | 55,539 | 9.5% |
[ 0.5% - 1.0% ] 0.70% | 110,941 | 5.4% |
[ 0.5% - 1.0% ] 0.71% | 8,262 | 3.1% |
[ 0.5% - 1.0% ] 0.77% | 44,832 | 3.0% |
[ 0.5% - 1.0% ] 0.82% | 89,368 | 6.2% |
[ 0.5% - 1.0% ] 0.84% | 135,733 | 3.8% |
[ 0.5% - 1.0% ] 0.87% | 92,348 | 3.4% |
[ 0.5% - 1.0% ] 0.88% | 23,244 | 9.1% |
[ 0.5% - 1.0% ] 0.91% | 7,224 | 6.7% |
[ 0.5% - 1.0% ] 0.93% | 2,246 | 12.9% |
[ 0.5% - 1.0% ] 0.96% | 4,666 | 9.5% |
[ 1.0% - 1.5% ] 1.04% | 2,118 | 7.7% |
[ 1.0% - 1.5% ] 1.04% | 766 | 13.9% |
[ 1.0% - 1.5% ] 1.08% | 1,020 | 12.2% |
[ 1.0% - 1.5% ] 1.10% | 5,449 | 4.5% |
[ 1.0% - 1.5% ] 1.15% | 5,831 | 10.4% |
[ 1.0% - 1.5% ] 1.22% | 83,125 | 0.39% |
[ 1.0% - 1.5% ] 1.27% | 89,976 | 1.2% |
[ 1.5% - 2.0% ] 1.51% | 2,982 | 6.9% |
[ 2.0% - 2.5% ] 2.03% | 69,131 | 0.11% |
[ 2.0% - 2.5% ] 2.12% | 101,053 | 0.23% |
[ 2.0% - 2.5% ] 2.15% | 63,165 | 1.0% |
[ 2.0% - 2.5% ] 2.16% | 84,006 | 0.46% |
[ 2.0% - 2.5% ] 2.38% | 100,082 | 0.49% |
[ 2.5% - 3.0% ] 2.71% | 1,216 | 8.4% |
[ 2.5% - 3.0% ] 2.96% | 6,444 | 6.9% |
[ 4.0% - 4.5% ] 4.05% | 78,506 | 0.34% |
[ 4.5% - 5.0% ] 4.73% | 2,262 | 4.9% |