Immigrants from Grenada Disability
COMPARE
Immigrants from Grenada
Select to Compare
Disability
Immigrants from Grenada Disability
11.5%
DISABILITY
86.1/ 100
METRIC RATING
141st/ 347
METRIC RANK
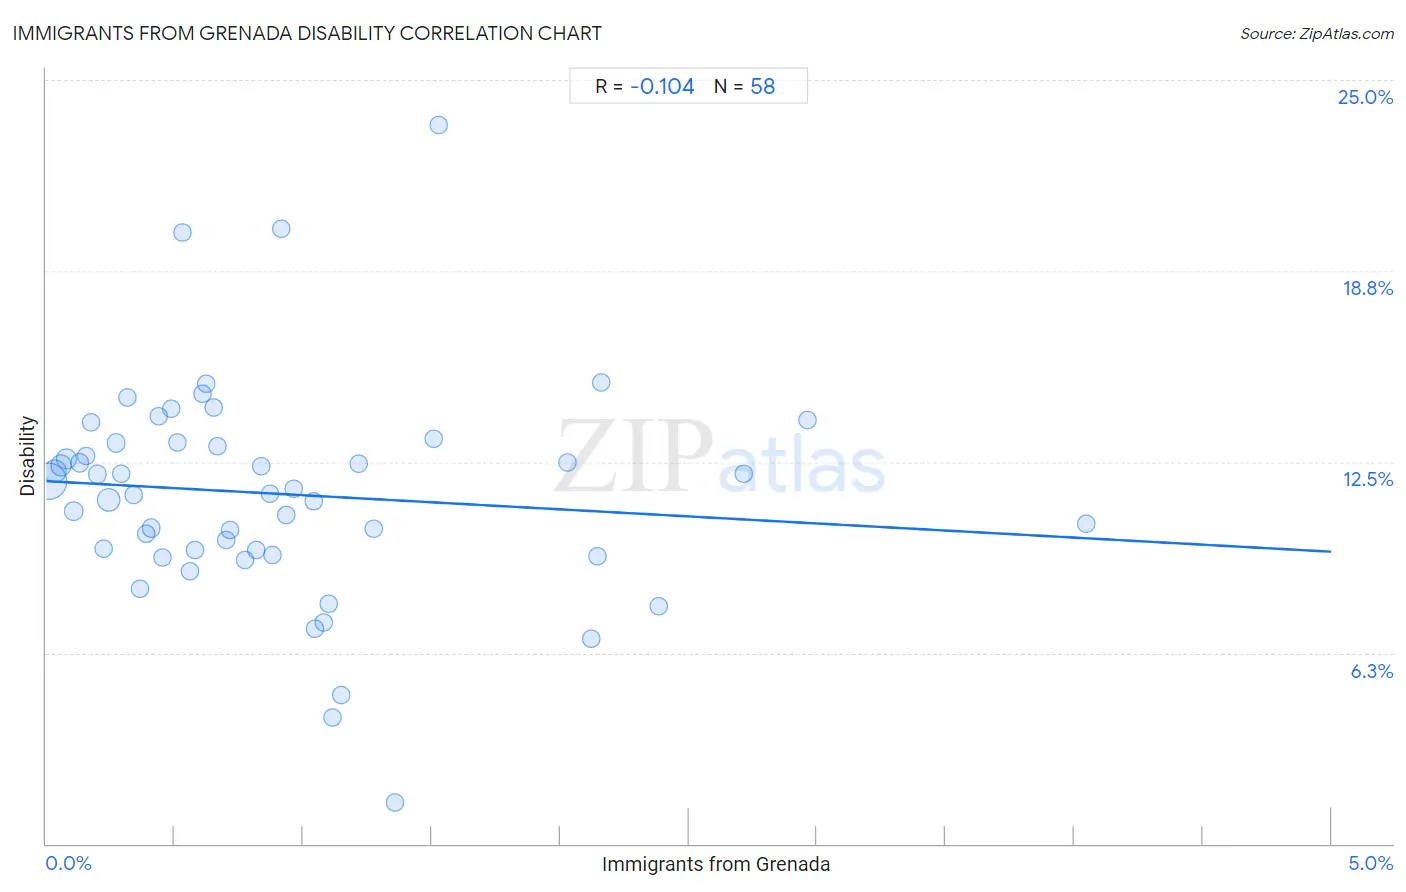
Immigrants from Grenada Disability Correlation Chart
The statistical analysis conducted on geographies consisting of 67,198,924 people shows a poor negative correlation between the proportion of Immigrants from Grenada and percentage of population with a disability in the United States with a correlation coefficient (R) of -0.104 and weighted average of 11.5%. On average, for every 1% (one percent) increase in Immigrants from Grenada within a typical geography, there is a decrease of 0.46% in percentage of population with a disability.
It is essential to understand that the correlation between the percentage of Immigrants from Grenada and percentage of population with a disability does not imply a direct cause-and-effect relationship. It remains uncertain whether the presence of Immigrants from Grenada influences an upward or downward trend in the level of percentage of population with a disability within an area, or if Immigrants from Grenada simply ended up residing in those areas with higher or lower levels of percentage of population with a disability due to other factors.
Demographics Similar to Immigrants from Grenada by Disability
In terms of disability, the demographic groups most similar to Immigrants from Grenada are Russian (11.5%, a difference of 0.070%), Immigrants from Sudan (11.5%, a difference of 0.070%), Ghanaian (11.5%, a difference of 0.080%), New Zealander (11.5%, a difference of 0.090%), and Kenyan (11.5%, a difference of 0.10%).
| Demographics | Rating | Rank | Disability |
| Immigrants from Guyana | 88.3 /100 | #134 | Excellent 11.4% |
| Ugandans | 87.9 /100 | #135 | Excellent 11.4% |
| Immigrants from St. Vincent and the Grenadines | 87.8 /100 | #136 | Excellent 11.4% |
| Kenyans | 87.1 /100 | #137 | Excellent 11.5% |
| New Zealanders | 87.0 /100 | #138 | Excellent 11.5% |
| Ghanaians | 87.0 /100 | #139 | Excellent 11.5% |
| Russians | 86.8 /100 | #140 | Excellent 11.5% |
| Immigrants from Grenada | 86.1 /100 | #141 | Excellent 11.5% |
| Immigrants from Sudan | 85.3 /100 | #142 | Excellent 11.5% |
| Moroccans | 83.3 /100 | #143 | Excellent 11.5% |
| Australians | 82.5 /100 | #144 | Excellent 11.5% |
| Nigerians | 81.3 /100 | #145 | Excellent 11.5% |
| Immigrants from Hungary | 79.0 /100 | #146 | Good 11.5% |
| Immigrants from Ukraine | 77.6 /100 | #147 | Good 11.5% |
| Sudanese | 77.1 /100 | #148 | Good 11.5% |
Immigrants from Grenada Disability Correlation Summary
| Measurement | Immigrants from Grenada Data | Disability Data |
| Minimum | 0.0078% | 1.4% |
| Maximum | 4.0% | 23.5% |
| Range | 4.0% | 22.2% |
| Mean | 0.90% | 11.5% |
| Median | 0.68% | 11.5% |
| Interquartile 25% (IQ1) | 0.34% | 9.6% |
| Interquartile 75% (IQ3) | 1.1% | 13.1% |
| Interquartile Range (IQR) | 0.77% | 3.5% |
| Standard Deviation (Sample) | 0.81% | 3.6% |
| Standard Deviation (Population) | 0.80% | 3.6% |
Correlation Details
| Immigrants from Grenada Percentile | Sample Size | Disability |
[ 0.0% - 0.5% ] 0.0078% | 32,465,186 | 11.9% |
[ 0.0% - 0.5% ] 0.035% | 8,810,528 | 12.2% |
[ 0.0% - 0.5% ] 0.056% | 4,892,971 | 12.4% |
[ 0.0% - 0.5% ] 0.079% | 3,622,218 | 12.6% |
[ 0.0% - 0.5% ] 0.11% | 2,383,933 | 10.9% |
[ 0.0% - 0.5% ] 0.13% | 1,100,502 | 12.5% |
[ 0.0% - 0.5% ] 0.15% | 722,508 | 12.7% |
[ 0.0% - 0.5% ] 0.17% | 543,353 | 13.8% |
[ 0.0% - 0.5% ] 0.20% | 441,547 | 12.1% |
[ 0.0% - 0.5% ] 0.22% | 291,441 | 9.7% |
[ 0.0% - 0.5% ] 0.24% | 8,948,928 | 11.3% |
[ 0.0% - 0.5% ] 0.27% | 517,520 | 13.1% |
[ 0.0% - 0.5% ] 0.29% | 103,039 | 12.1% |
[ 0.0% - 0.5% ] 0.32% | 186,733 | 14.6% |
[ 0.0% - 0.5% ] 0.34% | 159,085 | 11.4% |
[ 0.0% - 0.5% ] 0.36% | 29,885 | 8.3% |
[ 0.0% - 0.5% ] 0.39% | 35,358 | 10.2% |
[ 0.0% - 0.5% ] 0.41% | 67,084 | 10.3% |
[ 0.0% - 0.5% ] 0.44% | 194,448 | 14.0% |
[ 0.0% - 0.5% ] 0.45% | 7,515 | 9.4% |
[ 0.0% - 0.5% ] 0.49% | 108,302 | 14.2% |
[ 0.5% - 1.0% ] 0.51% | 120,043 | 13.2% |
[ 0.5% - 1.0% ] 0.53% | 14,753 | 20.0% |
[ 0.5% - 1.0% ] 0.56% | 537 | 8.9% |
[ 0.5% - 1.0% ] 0.58% | 18,014 | 9.6% |
[ 0.5% - 1.0% ] 0.61% | 19,086 | 14.7% |
[ 0.5% - 1.0% ] 0.62% | 56,572 | 15.0% |
[ 0.5% - 1.0% ] 0.65% | 65,549 | 14.3% |
[ 0.5% - 1.0% ] 0.67% | 55,539 | 13.0% |
[ 0.5% - 1.0% ] 0.70% | 110,941 | 9.9% |
[ 0.5% - 1.0% ] 0.71% | 8,262 | 10.3% |
[ 0.5% - 1.0% ] 0.77% | 44,832 | 9.3% |
[ 0.5% - 1.0% ] 0.82% | 89,368 | 9.6% |
[ 0.5% - 1.0% ] 0.84% | 135,733 | 12.4% |
[ 0.5% - 1.0% ] 0.87% | 92,348 | 11.5% |
[ 0.5% - 1.0% ] 0.88% | 23,244 | 9.5% |
[ 0.5% - 1.0% ] 0.91% | 7,224 | 20.1% |
[ 0.5% - 1.0% ] 0.93% | 2,246 | 10.8% |
[ 0.5% - 1.0% ] 0.96% | 4,666 | 11.6% |
[ 1.0% - 1.5% ] 1.04% | 2,118 | 11.2% |
[ 1.0% - 1.5% ] 1.04% | 766 | 7.0% |
[ 1.0% - 1.5% ] 1.08% | 1,020 | 7.3% |
[ 1.0% - 1.5% ] 1.10% | 5,449 | 7.9% |
[ 1.0% - 1.5% ] 1.11% | 629 | 4.1% |
[ 1.0% - 1.5% ] 1.15% | 5,831 | 4.9% |
[ 1.0% - 1.5% ] 1.22% | 83,125 | 12.4% |
[ 1.0% - 1.5% ] 1.27% | 89,976 | 10.3% |
[ 1.0% - 1.5% ] 1.35% | 812 | 1.4% |
[ 1.5% - 2.0% ] 1.51% | 2,982 | 13.2% |
[ 1.5% - 2.0% ] 1.53% | 1,572 | 23.5% |
[ 2.0% - 2.5% ] 2.03% | 69,131 | 12.5% |
[ 2.0% - 2.5% ] 2.12% | 101,053 | 6.7% |
[ 2.0% - 2.5% ] 2.15% | 63,165 | 9.4% |
[ 2.0% - 2.5% ] 2.16% | 84,006 | 15.1% |
[ 2.0% - 2.5% ] 2.38% | 100,082 | 7.8% |
[ 2.5% - 3.0% ] 2.71% | 1,216 | 12.1% |
[ 2.5% - 3.0% ] 2.96% | 6,444 | 13.9% |
[ 4.0% - 4.5% ] 4.05% | 78,506 | 10.5% |