Immigrants from Germany Married-couple Households
COMPARE
Immigrants from Germany
Select to Compare
Married-couple Households
Immigrants from Germany Married-couple Households
47.5%
MARRIED-COUPLE HOUSEHOLDS
92.4/ 100
METRIC RATING
118th/ 347
METRIC RANK
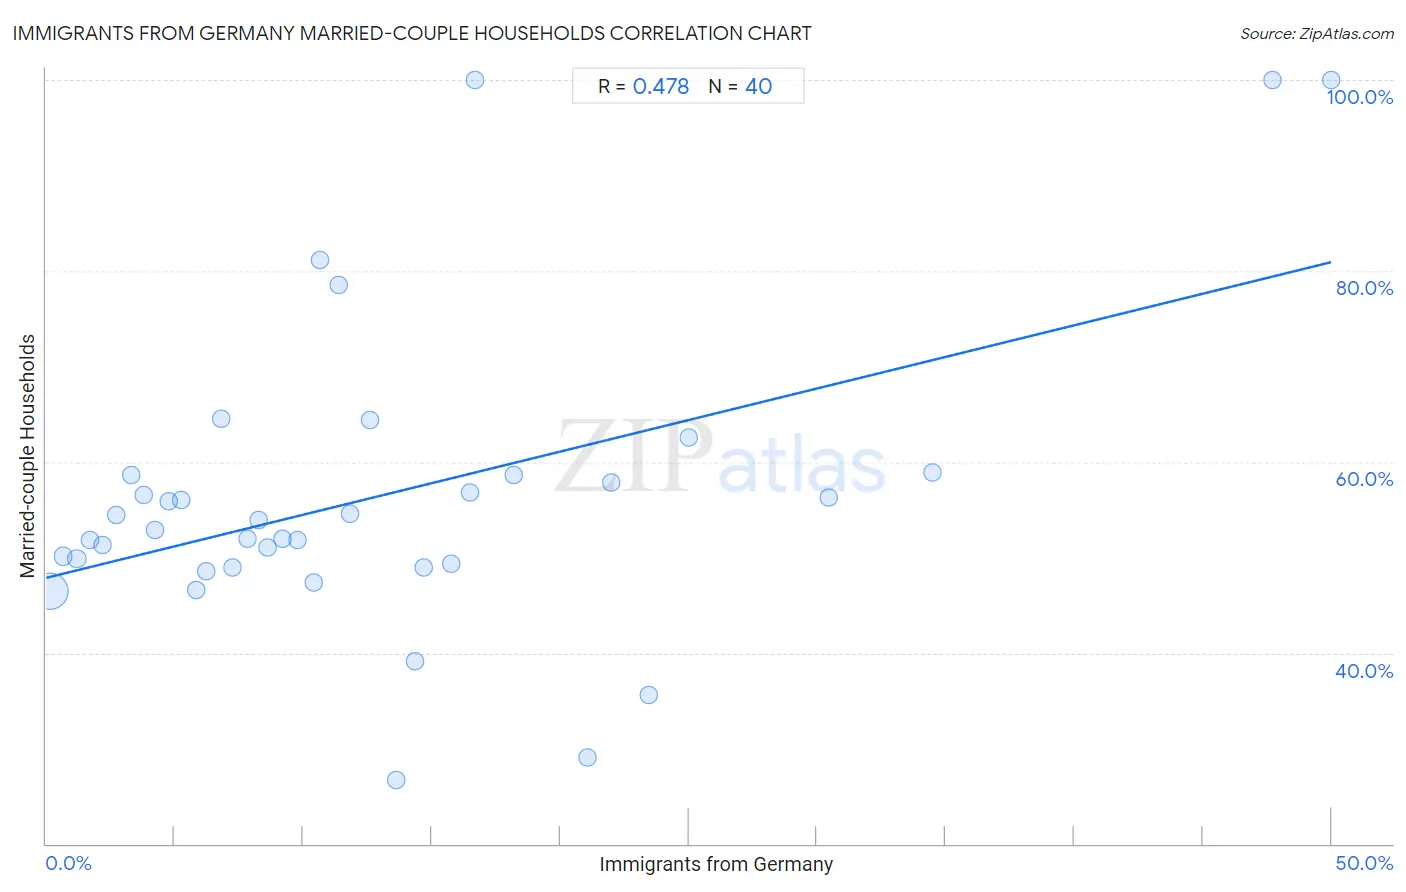
Immigrants from Germany Married-couple Households Correlation Chart
The statistical analysis conducted on geographies consisting of 463,743,898 people shows a moderate positive correlation between the proportion of Immigrants from Germany and percentage of married-couple family households in the United States with a correlation coefficient (R) of 0.478 and weighted average of 47.5%. On average, for every 1% (one percent) increase in Immigrants from Germany within a typical geography, there is an increase of 0.66% in percentage of married-couple family households.
It is essential to understand that the correlation between the percentage of Immigrants from Germany and percentage of married-couple family households does not imply a direct cause-and-effect relationship. It remains uncertain whether the presence of Immigrants from Germany influences an upward or downward trend in the level of percentage of married-couple family households within an area, or if Immigrants from Germany simply ended up residing in those areas with higher or lower levels of percentage of married-couple family households due to other factors.
Demographics Similar to Immigrants from Germany by Married-couple Households
In terms of married-couple households, the demographic groups most similar to Immigrants from Germany are French Canadian (47.5%, a difference of 0.010%), Argentinean (47.5%, a difference of 0.020%), Chilean (47.5%, a difference of 0.030%), Slovak (47.6%, a difference of 0.070%), and Immigrants from Europe (47.6%, a difference of 0.19%).
| Demographics | Rating | Rank | Married-couple Households |
| Syrians | 93.9 /100 | #111 | Exceptional 47.6% |
| Peruvians | 93.8 /100 | #112 | Exceptional 47.6% |
| Venezuelans | 93.8 /100 | #113 | Exceptional 47.6% |
| Immigrants from Europe | 93.7 /100 | #114 | Exceptional 47.6% |
| Slovaks | 92.9 /100 | #115 | Exceptional 47.6% |
| Argentineans | 92.5 /100 | #116 | Exceptional 47.5% |
| French Canadians | 92.4 /100 | #117 | Exceptional 47.5% |
| Immigrants from Germany | 92.4 /100 | #118 | Exceptional 47.5% |
| Chileans | 92.2 /100 | #119 | Exceptional 47.5% |
| Puget Sound Salish | 90.5 /100 | #120 | Exceptional 47.4% |
| Immigrants from Eastern Europe | 90.3 /100 | #121 | Exceptional 47.4% |
| Okinawans | 90.1 /100 | #122 | Exceptional 47.4% |
| Immigrants from Venezuela | 89.3 /100 | #123 | Excellent 47.4% |
| Zimbabweans | 89.2 /100 | #124 | Excellent 47.4% |
| Australians | 89.0 /100 | #125 | Excellent 47.4% |
Immigrants from Germany Married-couple Households Correlation Summary
| Measurement | Immigrants from Germany Data | Married-couple Households Data |
| Minimum | 0.16% | 26.7% |
| Maximum | 50.0% | 100.0% |
| Range | 49.8% | 73.3% |
| Mean | 13.0% | 56.5% |
| Median | 10.1% | 53.4% |
| Interquartile 25% (IQ1) | 5.0% | 49.1% |
| Interquartile 75% (IQ3) | 16.6% | 58.6% |
| Interquartile Range (IQR) | 11.6% | 9.5% |
| Standard Deviation (Sample) | 11.6% | 16.1% |
| Standard Deviation (Population) | 11.5% | 15.9% |
Correlation Details
| Immigrants from Germany Percentile | Sample Size | Married-couple Households |
[ 0.0% - 0.5% ] 0.16% | 431,463,095 | 46.4% |
[ 0.5% - 1.0% ] 0.66% | 26,963,674 | 50.1% |
[ 1.0% - 1.5% ] 1.19% | 3,577,596 | 49.9% |
[ 1.5% - 2.0% ] 1.71% | 950,823 | 51.8% |
[ 2.0% - 2.5% ] 2.21% | 350,150 | 51.3% |
[ 2.5% - 3.0% ] 2.71% | 204,403 | 54.4% |
[ 3.0% - 3.5% ] 3.30% | 82,467 | 58.6% |
[ 3.5% - 4.0% ] 3.80% | 30,563 | 56.5% |
[ 4.0% - 4.5% ] 4.22% | 30,654 | 52.9% |
[ 4.5% - 5.0% ] 4.77% | 22,668 | 55.9% |
[ 5.0% - 5.5% ] 5.26% | 22,987 | 56.0% |
[ 5.5% - 6.0% ] 5.85% | 8,091 | 46.5% |
[ 6.0% - 6.5% ] 6.20% | 4,466 | 48.5% |
[ 6.5% - 7.0% ] 6.82% | 2,874 | 64.5% |
[ 7.0% - 7.5% ] 7.27% | 6,384 | 48.9% |
[ 7.5% - 8.0% ] 7.81% | 5,713 | 52.0% |
[ 8.0% - 8.5% ] 8.26% | 2,240 | 53.9% |
[ 8.5% - 9.0% ] 8.61% | 8,273 | 51.0% |
[ 9.0% - 9.5% ] 9.20% | 1,033 | 51.9% |
[ 9.5% - 10.0% ] 9.78% | 317 | 51.8% |
[ 10.0% - 10.5% ] 10.42% | 1,209 | 47.4% |
[ 10.5% - 11.0% ] 10.67% | 150 | 81.2% |
[ 11.0% - 11.5% ] 11.39% | 439 | 78.5% |
[ 11.5% - 12.0% ] 11.84% | 152 | 54.5% |
[ 12.5% - 13.0% ] 12.61% | 595 | 64.3% |
[ 13.5% - 14.0% ] 13.64% | 44 | 26.7% |
[ 14.0% - 14.5% ] 14.36% | 202 | 39.1% |
[ 14.5% - 15.0% ] 14.69% | 177 | 49.0% |
[ 15.5% - 16.0% ] 15.75% | 273 | 49.3% |
[ 16.0% - 16.5% ] 16.47% | 607 | 56.7% |
[ 16.5% - 17.0% ] 16.67% | 144 | 100.0% |
[ 18.0% - 18.5% ] 18.19% | 830 | 58.7% |
[ 21.0% - 21.5% ] 21.05% | 95 | 29.0% |
[ 21.5% - 22.0% ] 21.98% | 91 | 57.9% |
[ 23.0% - 23.5% ] 23.42% | 222 | 35.6% |
[ 25.0% - 25.5% ] 25.00% | 16 | 62.5% |
[ 30.0% - 30.5% ] 30.43% | 46 | 56.2% |
[ 34.0% - 34.5% ] 34.48% | 58 | 58.8% |
[ 47.5% - 48.0% ] 47.69% | 65 | 100.0% |
[ 50.0% - 50.5% ] 50.00% | 12 | 100.0% |