Immigrants from Germany Disability Age Under 5
COMPARE
Immigrants from Germany
Select to Compare
Disability Age Under 5
Immigrants from Germany Disability Age Under 5
1.4%
DISABILITY | AGE UNDER 5
0.1/ 100
METRIC RATING
266th/ 347
METRIC RANK
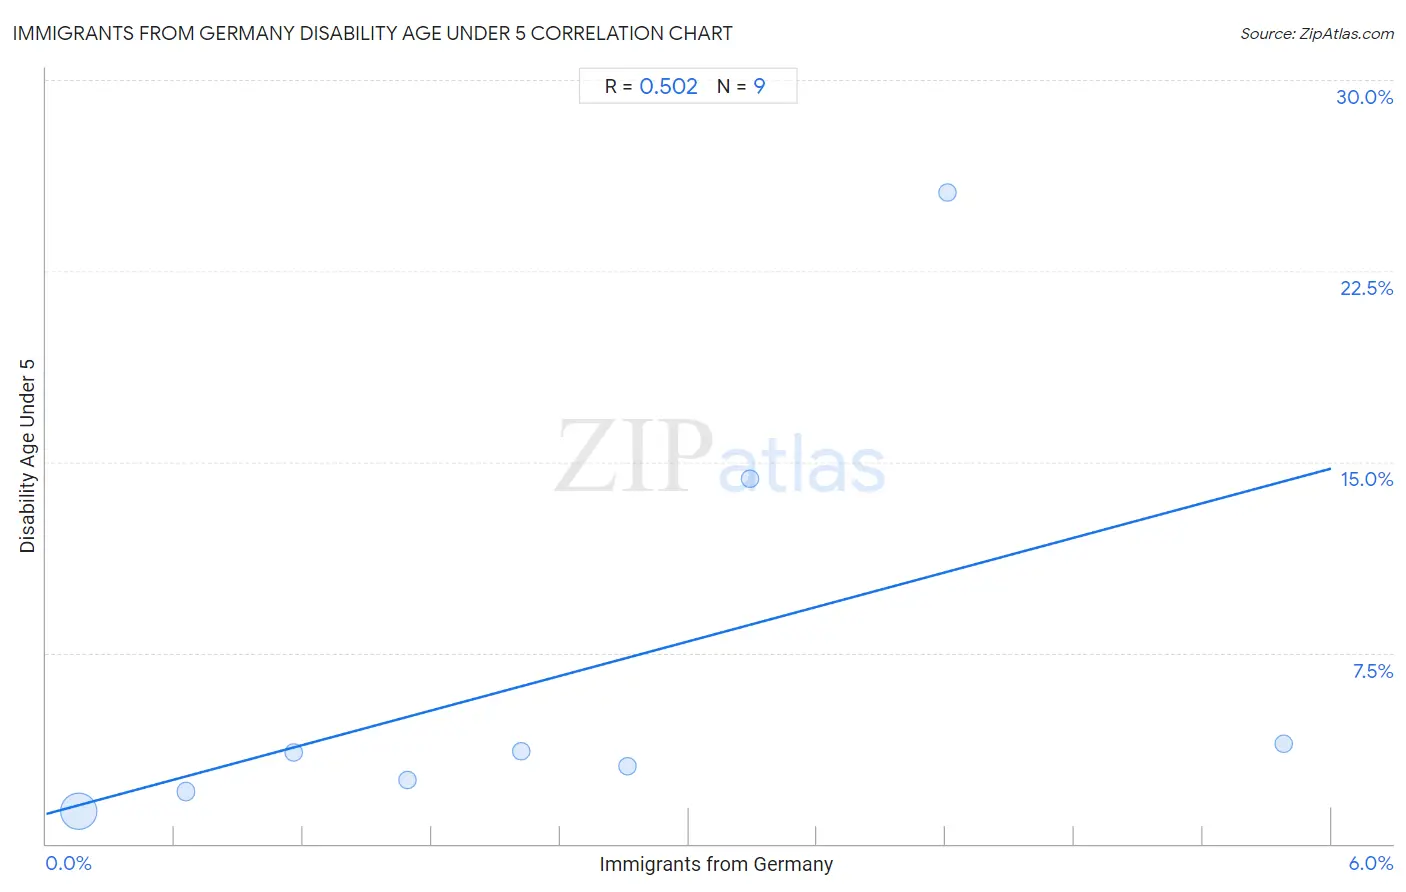
Immigrants from Germany Disability Age Under 5 Correlation Chart
The statistical analysis conducted on geographies consisting of 235,379,937 people shows a substantial positive correlation between the proportion of Immigrants from Germany and percentage of population with a disability under the age of 5 in the United States with a correlation coefficient (R) of 0.502 and weighted average of 1.4%. On average, for every 1% (one percent) increase in Immigrants from Germany within a typical geography, there is an increase of 2.3% in percentage of population with a disability under the age of 5.
It is essential to understand that the correlation between the percentage of Immigrants from Germany and percentage of population with a disability under the age of 5 does not imply a direct cause-and-effect relationship. It remains uncertain whether the presence of Immigrants from Germany influences an upward or downward trend in the level of percentage of population with a disability under the age of 5 within an area, or if Immigrants from Germany simply ended up residing in those areas with higher or lower levels of percentage of population with a disability under the age of 5 due to other factors.
Demographics Similar to Immigrants from Germany by Disability Age Under 5
In terms of disability age under 5, the demographic groups most similar to Immigrants from Germany are Carpatho Rusyn (1.4%, a difference of 0.030%), Yugoslavian (1.4%, a difference of 0.080%), Spanish (1.4%, a difference of 0.22%), Immigrants from Dominica (1.4%, a difference of 0.28%), and Immigrants from Netherlands (1.4%, a difference of 0.44%).
| Demographics | Rating | Rank | Disability Age Under 5 |
| Immigrants from Southern Europe | 0.3 /100 | #259 | Tragic 1.4% |
| Slavs | 0.3 /100 | #260 | Tragic 1.4% |
| Immigrants from Netherlands | 0.2 /100 | #261 | Tragic 1.4% |
| Immigrants from Dominica | 0.2 /100 | #262 | Tragic 1.4% |
| Spanish | 0.2 /100 | #263 | Tragic 1.4% |
| Yugoslavians | 0.1 /100 | #264 | Tragic 1.4% |
| Carpatho Rusyns | 0.1 /100 | #265 | Tragic 1.4% |
| Immigrants from Germany | 0.1 /100 | #266 | Tragic 1.4% |
| Cree | 0.1 /100 | #267 | Tragic 1.4% |
| Belgians | 0.1 /100 | #268 | Tragic 1.4% |
| Austrians | 0.1 /100 | #269 | Tragic 1.4% |
| Immigrants from North America | 0.1 /100 | #270 | Tragic 1.4% |
| Immigrants from Canada | 0.1 /100 | #271 | Tragic 1.4% |
| Blacks/African Americans | 0.1 /100 | #272 | Tragic 1.4% |
| Alaskan Athabascans | 0.1 /100 | #273 | Tragic 1.5% |
Immigrants from Germany Disability Age Under 5 Correlation Summary
| Measurement | Immigrants from Germany Data | Disability Age Under 5 Data |
| Minimum | 0.15% | 1.3% |
| Maximum | 5.8% | 25.6% |
| Range | 5.6% | 24.3% |
| Mean | 2.4% | 6.7% |
| Median | 2.2% | 3.6% |
| Interquartile 25% (IQ1) | 0.90% | 2.3% |
| Interquartile 75% (IQ3) | 3.7% | 9.1% |
| Interquartile Range (IQR) | 2.8% | 6.8% |
| Standard Deviation (Sample) | 1.8% | 8.1% |
| Standard Deviation (Population) | 1.7% | 7.6% |
Correlation Details
| Immigrants from Germany Percentile | Sample Size | Disability Age Under 5 |
[ 0.0% - 0.5% ] 0.15% | 226,842,591 | 1.3% |
[ 0.5% - 1.0% ] 0.65% | 7,908,529 | 2.1% |
[ 1.0% - 1.5% ] 1.15% | 473,038 | 3.6% |
[ 1.5% - 2.0% ] 1.68% | 51,821 | 2.5% |
[ 2.0% - 2.5% ] 2.22% | 45,759 | 3.6% |
[ 2.5% - 3.0% ] 2.72% | 54,287 | 3.0% |
[ 3.0% - 3.5% ] 3.29% | 3,041 | 14.3% |
[ 4.0% - 4.5% ] 4.21% | 594 | 25.6% |
[ 5.5% - 6.0% ] 5.78% | 277 | 3.9% |