Immigrants from Germany GED/Equivalency

COMPARE

Immigrants from Germany
Race
Ancestry
AfghanAfricanAlaska NativeAlaskan AthabascanAlbanianAleutAlsatianAmericanApacheArabArapahoArgentineanArmenianAssyrian/Chaldean/SyriacAustralianAustrianBahamianBangladeshiBarbadianBasqueBelgianBelizeanBermudanBhutaneseBlackfeetBolivianBrazilianBritishBritish West IndianBulgarianBurmeseCajunCambodianCanadianCape VerdeanCarpatho RusynCelticCentral AmericanCentral American IndianCherokeeCheyenneChickasawChileanChineseChippewaChoctawColombianColvilleComancheCosta RicanCreeCreekCroatianCrowCubanCypriotCzechCzechoslovakianDanishDelawareDominicanDutchDutch West IndianEastern EuropeanEcuadorianEgyptianEnglishEstonianEthiopianEuropeanFijianFilipinoFinnishFrenchFrench American IndianFrench CanadianGermanGerman RussianGhanaianGreekGuamanian/ChamorroGuatemalanGuyaneseHaitianHmongHonduranHopiHoumaHungarianIcelanderIndian (Asian)IndonesianInupiatIranianIraqiIrishIroquoisIsraeliItalianJamaicanJapaneseJordanianKenyanKiowaKoreanLaotianLatvianLebaneseLiberianLithuanianLumbeeLuxembourgerMacedonianMalaysianMalteseMarshalleseMenomineeMexicanMexican American IndianMongolianMoroccanNative HawaiianNavajoNepaleseNew ZealanderNicaraguanNigerianNorthern EuropeanNorwegianOkinawanOsageOttawaPaiutePakistaniPalestinianPanamanianParaguayanPennsylvania GermanPeruvianPimaPolishPortuguesePotawatomiPuebloPuerto RicanPuget Sound SalishRomanianRussianSalvadoranSamoanScandinavianScotch-IrishScottishSeminoleSenegaleseSerbianShoshoneSierra LeoneanSiouxSlavicSlovakSloveneSomaliSouth AfricanSouth AmericanSouth American IndianSoviet UnionSpaniardSpanishSpanish AmericanSpanish American IndianSri LankanSubsaharan AfricanSudaneseSwedishSwissSyrianTaiwaneseThaiTlingit-HaidaTohono O'OdhamTonganTrinidadian and TobagonianTsimshianTurkishU.S. Virgin IslanderUgandanUkrainianUruguayanUteVenezuelanVietnameseWelshWest IndianYakamaYaquiYugoslavianYumanYup'ikZimbabwean
Immigration
NonimmigrantsImmigrantsAfghanistanAfricaAlbaniaArgentinaArmeniaAsiaAustraliaAustriaBahamasBangladeshBarbadosBelarusBelgiumBelizeBoliviaBosnia and HerzegovinaBrazilBulgariaBurma/MyanmarCabo VerdeCambodiaCameroonCanadaCaribbeanCentral AmericaChileChinaColombiaCongoCosta RicaCroatiaCubaCzechoslovakiaDenmarkDominicaDominican RepublicEastern AfricaEastern AsiaEastern EuropeEcuadorEgyptEl SalvadorEnglandEritreaEthiopiaEuropeFijiFranceGermanyGhanaGreeceGrenadaGuatemalaGuyanaHaitiHondurasHong KongHungaryIndiaIndonesiaIranIraqIrelandIsraelItalyJamaicaJapanJordanKazakhstanKenyaKoreaKuwaitLaosLatin AmericaLatviaLebanonLiberiaLithuaniaMalaysiaMexicoMicronesiaMiddle AfricaMoldovaMoroccoNepalNetherlandsNicaraguaNigeriaNorth AmericaNorth MacedoniaNorthern AfricaNorthern EuropeNorwayOceaniaPakistanPanamaPeruPhilippinesPolandPortugalRomaniaRussiaSaudi ArabiaScotlandSenegalSerbiaSierra LeoneSingaporeSomaliaSouth AfricaSouth AmericaSouth Central AsiaSouth Eastern AsiaSouthern EuropeSpainSri LankaSt. Vincent and the GrenadinesSudanSwedenSwitzerlandSyriaTaiwanThailandTrinidad and TobagoTurkeyUgandaUkraineUruguayUzbekistanVenezuelaVietnamWest IndiesWestern AfricaWestern AsiaWestern EuropeYemenZaireZimbabweAzores
Select to Compare
Race
Ancestry
AfghanAfricanAlaska NativeAlaskan AthabascanAlbanianAleutAlsatianAmericanApacheArabArapahoArgentineanArmenianAssyrian/Chaldean/SyriacAustralianAustrianBahamianBangladeshiBarbadianBasqueBelgianBelizeanBermudanBhutaneseBlackfeetBolivianBrazilianBritishBritish West IndianBulgarianBurmeseCajunCambodianCanadianCape VerdeanCarpatho RusynCelticCentral AmericanCentral American IndianCherokeeCheyenneChickasawChileanChineseChippewaChoctawColombianColvilleComancheCosta RicanCreeCreekCroatianCrowCubanCypriotCzechCzechoslovakianDanishDelawareDominicanDutchDutch West IndianEastern EuropeanEcuadorianEgyptianEnglishEstonianEthiopianEuropeanFijianFilipinoFinnishFrenchFrench American IndianFrench CanadianGermanGerman RussianGhanaianGreekGuamanian/ChamorroGuatemalanGuyaneseHaitianHmongHonduranHopiHoumaHungarianIcelanderIndian (Asian)IndonesianInupiatIranianIraqiIrishIroquoisIsraeliItalianJamaicanJapaneseJordanianKenyanKiowaKoreanLaotianLatvianLebaneseLiberianLithuanianLumbeeLuxembourgerMacedonianMalaysianMalteseMarshalleseMenomineeMexicanMexican American IndianMongolianMoroccanNative HawaiianNavajoNepaleseNew ZealanderNicaraguanNigerianNorthern EuropeanNorwegianOkinawanOsageOttawaPaiutePakistaniPalestinianPanamanianParaguayanPennsylvania GermanPeruvianPimaPolishPortuguesePotawatomiPuebloPuerto RicanPuget Sound SalishRomanianRussianSalvadoranSamoanScandinavianScotch-IrishScottishSeminoleSenegaleseSerbianShoshoneSierra LeoneanSiouxSlavicSlovakSloveneSomaliSouth AfricanSouth AmericanSouth American IndianSoviet UnionSpaniardSpanishSpanish AmericanSpanish American IndianSri LankanSubsaharan AfricanSudaneseSwedishSwissSyrianTaiwaneseThaiTlingit-HaidaTohono O'OdhamTonganTrinidadian and TobagonianTsimshianTurkishU.S. Virgin IslanderUgandanUkrainianUruguayanUteVenezuelanVietnameseWelshWest IndianYakamaYaquiYugoslavianYumanYup'ikZimbabwean
Immigration
NonimmigrantsImmigrantsAfghanistanAfricaAlbaniaArgentinaArmeniaAsiaAustraliaAustriaBahamasBangladeshBarbadosBelarusBelgiumBelizeBoliviaBosnia and HerzegovinaBrazilBulgariaBurma/MyanmarCabo VerdeCambodiaCameroonCanadaCaribbeanCentral AmericaChileChinaColombiaCongoCosta RicaCroatiaCubaCzechoslovakiaDenmarkDominicaDominican RepublicEastern AfricaEastern AsiaEastern EuropeEcuadorEgyptEl SalvadorEnglandEritreaEthiopiaEuropeFijiFranceGhanaGreeceGrenadaGuatemalaGuyanaHaitiHondurasHong KongHungaryIndiaIndonesiaIranIraqIrelandIsraelItalyJamaicaJapanJordanKazakhstanKenyaKoreaKuwaitLaosLatin AmericaLatviaLebanonLiberiaLithuaniaMalaysiaMexicoMicronesiaMiddle AfricaMoldovaMoroccoNepalNetherlandsNicaraguaNigeriaNorth AmericaNorth MacedoniaNorthern AfricaNorthern EuropeNorwayOceaniaPakistanPanamaPeruPhilippinesPolandPortugalRomaniaRussiaSaudi ArabiaScotlandSenegalSerbiaSierra LeoneSingaporeSomaliaSouth AfricaSouth AmericaSouth Central AsiaSouth Eastern AsiaSouthern EuropeSpainSri LankaSt. Vincent and the GrenadinesSudanSwedenSwitzerlandSyriaTaiwanThailandTrinidad and TobagoTurkeyUgandaUkraineUruguayUzbekistanVenezuelaVietnamWest IndiesWestern AfricaWestern AsiaWestern EuropeYemenZaireZimbabweAzores
GED/Equivalency
Income
Poverty
Unemployment
Labor Participation
Family Structure
Vehicle Availability
Education Level
Disability

Immigrants from Germany GED/Equivalency
Excellent

86.7%
GED/EQUIVALENCY
88.8/ 100
METRIC RATING
130th/ 347
METRIC RANK

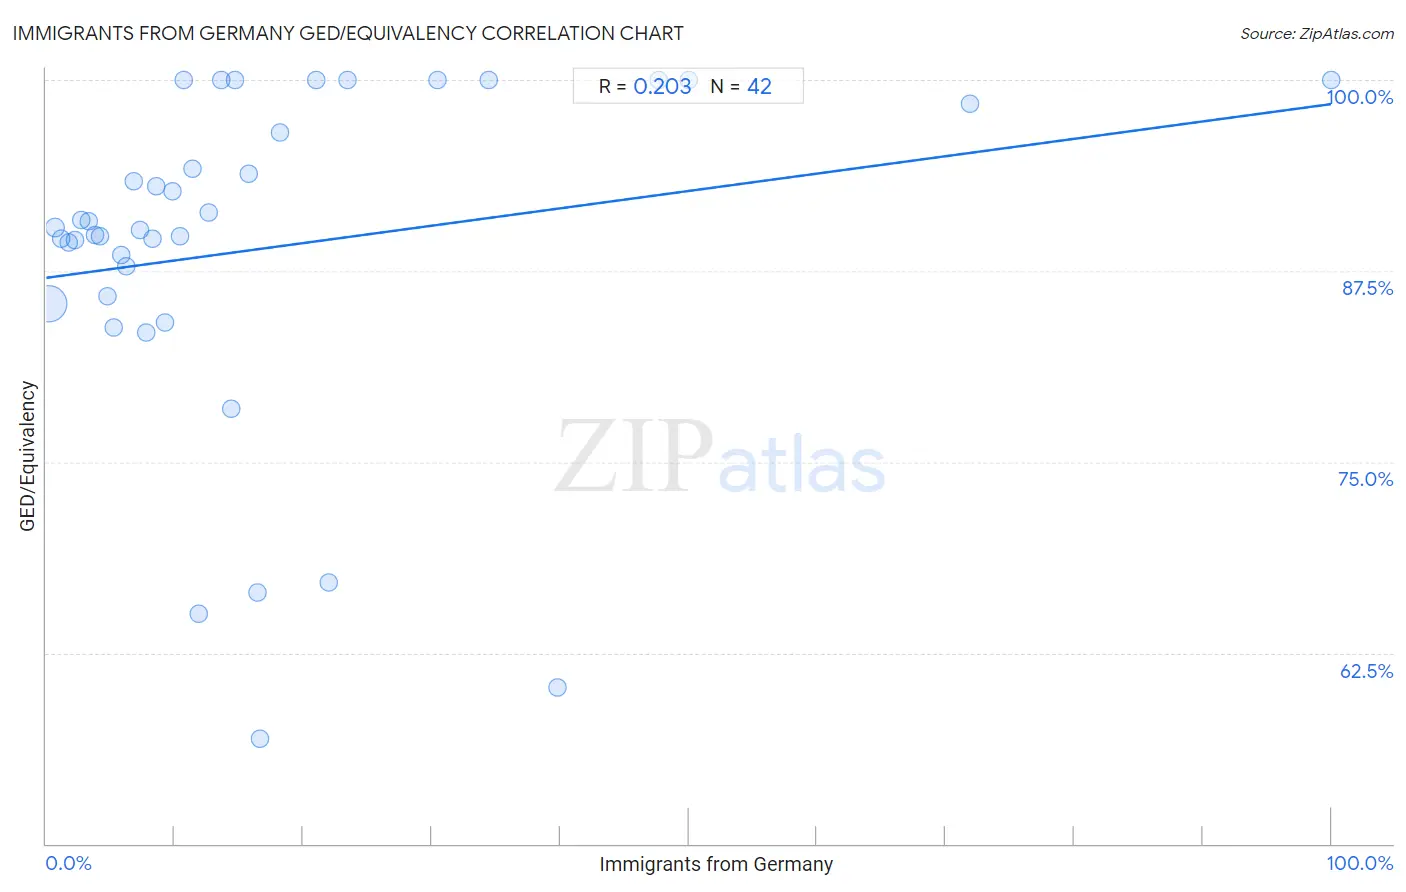
Immigrants from Germany GED/Equivalency Correlation Chart

The statistical analysis conducted on geographies consisting of 463,886,920 people shows a weak positive correlation between the proportion of Immigrants from Germany and percentage of population with at least ged/equivalency education in the United States with a correlation coefficient (R) of 0.203 and weighted average of 86.7%. On average, for every 1% (one percent) increase in Immigrants from Germany within a typical geography, there is an increase of 0.11% in percentage of population with at least ged/equivalency education.
Immigrants from Germany GED/Equivalency
It is essential to understand that the correlation between the percentage of Immigrants from Germany and percentage of population with at least ged/equivalency education does not imply a direct cause-and-effect relationship. It remains uncertain whether the presence of Immigrants from Germany influences an upward or downward trend in the level of percentage of population with at least ged/equivalency education within an area, or if Immigrants from Germany simply ended up residing in those areas with higher or lower levels of percentage of population with at least ged/equivalency education due to other factors.

Demographics Similar to Immigrants from Germany by GED/Equivalency

In terms of ged/equivalency, the demographic groups most similar to Immigrants from Germany are Immigrants from Ukraine (86.7%, a difference of 0.0%), Immigrants from Spain (86.7%, a difference of 0.020%), Immigrants from Brazil (86.6%, a difference of 0.020%), Yugoslavian (86.7%, a difference of 0.030%), and Tsimshian (86.6%, a difference of 0.030%).
DemographicsRating | RankGED/Equivalency
Immigrants from Italy
90.5
/100
|
#123
Exceptional
86.7%
Immigrants from Egypt
90.4
/100
|
#124
Exceptional
86.7%
Celtics
90.4
/100
|
#125
Exceptional
86.7%
Asians
90.3
/100
|
#126
Exceptional
86.7%
Argentineans
89.7
/100
|
#127
Excellent
86.7%
Yugoslavians
89.5
/100
|
#128
Excellent
86.7%
Immigrants from Ukraine
88.9
/100
|
#129
Excellent
86.7%
Immigrants from Germany
88.8
/100
|
#130
Excellent
86.7%
Immigrants from Spain
88.5
/100
|
#131
Excellent
86.7%
Immigrants from Brazil
88.4
/100
|
#132
Excellent
86.6%
Tsimshian
88.3
/100
|
#133
Excellent
86.6%
Albanians
87.7
/100
|
#134
Excellent
86.6%
Immigrants from Asia
87.4
/100
|
#135
Excellent
86.6%
Chileans
86.9
/100
|
#136
Excellent
86.6%
Arabs
86.7
/100
|
#137
Excellent
86.6%

Immigrants from Germany GED/Equivalency Correlation Summary

MeasurementImmigrants from Germany DataGED/Equivalency Data
Minimum0.16%56.9%
Maximum100.0%100.0%
Range99.8%43.1%
Mean16.8%89.0%
Median10.5%90.3%
Interquartile 25% (IQ1)5.3%85.9%
Interquartile 75% (IQ3)18.2%98.4%
Interquartile Range (IQR)13.0%12.6%
Standard Deviation (Sample)19.9%11.2%
Standard Deviation (Population)19.7%11.0%

Correlation Details

Immigrants from Germany PercentileSample SizeGED/Equivalency
[
0.0%
-
0.5%
]
0.16%
431,570,95485.4%
[
0.5%
-
1.0%
]
0.66%
26,990,42390.4%
[
1.0%
-
1.5%
]
1.19%
3,582,31289.6%
[
1.5%
-
2.0%
]
1.71%
952,76989.4%
[
2.0%
-
2.5%
]
2.21%
350,15089.5%
[
2.5%
-
3.0%
]
2.71%
204,40390.8%
[
3.0%
-
3.5%
]
3.30%
82,46790.8%
[
3.5%
-
4.0%
]
3.80%
31,22089.8%
[
4.0%
-
4.5%
]
4.22%
30,65489.8%
[
4.5%
-
5.0%
]
4.77%
22,66885.9%
[
5.0%
-
5.5%
]
5.25%
23,32283.8%
[
5.5%
-
6.0%
]
5.85%
8,09188.6%
[
6.0%
-
6.5%
]
6.20%
4,46687.8%
[
6.5%
-
7.0%
]
6.82%
2,87493.4%
[
7.0%
-
7.5%
]
7.27%
6,38490.2%
[
7.5%
-
8.0%
]
7.80%
5,83083.5%
[
8.0%
-
8.5%
]
8.26%
2,24089.6%
[
8.5%
-
9.0%
]
8.61%
8,27393.0%
[
9.0%
-
9.5%
]
9.20%
1,03384.1%
[
9.5%
-
10.0%
]
9.78%
31792.7%
[
10.0%
-
10.5%
]
10.42%
1,20989.8%
[
10.5%
-
11.0%
]
10.67%
150100.0%
[
11.0%
-
11.5%
]
11.39%
43994.2%
[
11.5%
-
12.0%
]
11.84%
15265.1%
[
12.5%
-
13.0%
]
12.61%
59591.4%
[
13.5%
-
14.0%
]
13.64%
44100.0%
[
14.0%
-
14.5%
]
14.36%
20278.5%
[
14.5%
-
15.0%
]
14.69%
177100.0%
[
15.5%
-
16.0%
]
15.75%
27393.9%
[
16.0%
-
16.5%
]
16.47%
60766.5%
[
16.5%
-
17.0%
]
16.67%
14456.9%
[
18.0%
-
18.5%
]
18.23%
1,24096.6%
[
21.0%
-
21.5%
]
21.05%
95100.0%
[
21.5%
-
22.0%
]
21.98%
9167.1%
[
23.0%
-
23.5%
]
23.42%
222100.0%
[
30.0%
-
30.5%
]
30.43%
46100.0%
[
34.0%
-
34.5%
]
34.48%
58100.0%
[
39.5%
-
40.0%
]
39.78%
9360.2%
[
47.5%
-
48.0%
]
47.69%
65100.0%
[
50.0%
-
50.5%
]
50.00%
12100.0%
[
71.5%
-
72.0%
]
71.88%
12898.4%
[
99.5%
-
100.0%
]
100.00%
28100.0%