Immigrants from Germany Self-Care Disability

COMPARE

Immigrants from Germany
Race
Ancestry
AfghanAfricanAlaska NativeAlaskan AthabascanAlbanianAleutAlsatianAmericanApacheArabArapahoArgentineanArmenianAssyrian/Chaldean/SyriacAustralianAustrianBahamianBangladeshiBarbadianBasqueBelgianBelizeanBermudanBhutaneseBlackfeetBolivianBrazilianBritishBritish West IndianBulgarianBurmeseCajunCambodianCanadianCape VerdeanCarpatho RusynCelticCentral AmericanCentral American IndianCherokeeCheyenneChickasawChileanChineseChippewaChoctawColombianColvilleComancheCosta RicanCreeCreekCroatianCrowCubanCypriotCzechCzechoslovakianDanishDelawareDominicanDutchDutch West IndianEastern EuropeanEcuadorianEgyptianEnglishEstonianEthiopianEuropeanFijianFilipinoFinnishFrenchFrench American IndianFrench CanadianGermanGerman RussianGhanaianGreekGuamanian/ChamorroGuatemalanGuyaneseHaitianHmongHonduranHopiHoumaHungarianIcelanderIndian (Asian)IndonesianInupiatIranianIraqiIrishIroquoisIsraeliItalianJamaicanJapaneseJordanianKenyanKiowaKoreanLaotianLatvianLebaneseLiberianLithuanianLumbeeLuxembourgerMacedonianMalaysianMalteseMarshalleseMenomineeMexicanMexican American IndianMongolianMoroccanNative HawaiianNavajoNepaleseNew ZealanderNicaraguanNigerianNorthern EuropeanNorwegianOkinawanOsageOttawaPaiutePakistaniPalestinianPanamanianParaguayanPennsylvania GermanPeruvianPimaPolishPortuguesePotawatomiPuebloPuerto RicanPuget Sound SalishRomanianRussianSalvadoranSamoanScandinavianScotch-IrishScottishSeminoleSenegaleseSerbianShoshoneSierra LeoneanSiouxSlavicSlovakSloveneSomaliSouth AfricanSouth AmericanSouth American IndianSoviet UnionSpaniardSpanishSpanish AmericanSpanish American IndianSri LankanSubsaharan AfricanSudaneseSwedishSwissSyrianTaiwaneseThaiTlingit-HaidaTohono O'OdhamTonganTrinidadian and TobagonianTsimshianTurkishU.S. Virgin IslanderUgandanUkrainianUruguayanUteVenezuelanVietnameseWelshWest IndianYakamaYaquiYugoslavianYumanYup'ikZimbabwean
Immigration
NonimmigrantsImmigrantsAfghanistanAfricaAlbaniaArgentinaArmeniaAsiaAustraliaAustriaBahamasBangladeshBarbadosBelarusBelgiumBelizeBoliviaBosnia and HerzegovinaBrazilBulgariaBurma/MyanmarCabo VerdeCambodiaCameroonCanadaCaribbeanCentral AmericaChileChinaColombiaCongoCosta RicaCroatiaCubaCzechoslovakiaDenmarkDominicaDominican RepublicEastern AfricaEastern AsiaEastern EuropeEcuadorEgyptEl SalvadorEnglandEritreaEthiopiaEuropeFijiFranceGermanyGhanaGreeceGrenadaGuatemalaGuyanaHaitiHondurasHong KongHungaryIndiaIndonesiaIranIraqIrelandIsraelItalyJamaicaJapanJordanKazakhstanKenyaKoreaKuwaitLaosLatin AmericaLatviaLebanonLiberiaLithuaniaMalaysiaMexicoMicronesiaMiddle AfricaMoldovaMoroccoNepalNetherlandsNicaraguaNigeriaNorth AmericaNorth MacedoniaNorthern AfricaNorthern EuropeNorwayOceaniaPakistanPanamaPeruPhilippinesPolandPortugalRomaniaRussiaSaudi ArabiaScotlandSenegalSerbiaSierra LeoneSingaporeSomaliaSouth AfricaSouth AmericaSouth Central AsiaSouth Eastern AsiaSouthern EuropeSpainSri LankaSt. Vincent and the GrenadinesSudanSwedenSwitzerlandSyriaTaiwanThailandTrinidad and TobagoTurkeyUgandaUkraineUruguayUzbekistanVenezuelaVietnamWest IndiesWestern AfricaWestern AsiaWestern EuropeYemenZaireZimbabweAzores
Select to Compare
Race
Ancestry
AfghanAfricanAlaska NativeAlaskan AthabascanAlbanianAleutAlsatianAmericanApacheArabArapahoArgentineanArmenianAssyrian/Chaldean/SyriacAustralianAustrianBahamianBangladeshiBarbadianBasqueBelgianBelizeanBermudanBhutaneseBlackfeetBolivianBrazilianBritishBritish West IndianBulgarianBurmeseCajunCambodianCanadianCape VerdeanCarpatho RusynCelticCentral AmericanCentral American IndianCherokeeCheyenneChickasawChileanChineseChippewaChoctawColombianColvilleComancheCosta RicanCreeCreekCroatianCrowCubanCypriotCzechCzechoslovakianDanishDelawareDominicanDutchDutch West IndianEastern EuropeanEcuadorianEgyptianEnglishEstonianEthiopianEuropeanFijianFilipinoFinnishFrenchFrench American IndianFrench CanadianGermanGerman RussianGhanaianGreekGuamanian/ChamorroGuatemalanGuyaneseHaitianHmongHonduranHopiHoumaHungarianIcelanderIndian (Asian)IndonesianInupiatIranianIraqiIrishIroquoisIsraeliItalianJamaicanJapaneseJordanianKenyanKiowaKoreanLaotianLatvianLebaneseLiberianLithuanianLumbeeLuxembourgerMacedonianMalaysianMalteseMarshalleseMenomineeMexicanMexican American IndianMongolianMoroccanNative HawaiianNavajoNepaleseNew ZealanderNicaraguanNigerianNorthern EuropeanNorwegianOkinawanOsageOttawaPaiutePakistaniPalestinianPanamanianParaguayanPennsylvania GermanPeruvianPimaPolishPortuguesePotawatomiPuebloPuerto RicanPuget Sound SalishRomanianRussianSalvadoranSamoanScandinavianScotch-IrishScottishSeminoleSenegaleseSerbianShoshoneSierra LeoneanSiouxSlavicSlovakSloveneSomaliSouth AfricanSouth AmericanSouth American IndianSoviet UnionSpaniardSpanishSpanish AmericanSpanish American IndianSri LankanSubsaharan AfricanSudaneseSwedishSwissSyrianTaiwaneseThaiTlingit-HaidaTohono O'OdhamTonganTrinidadian and TobagonianTsimshianTurkishU.S. Virgin IslanderUgandanUkrainianUruguayanUteVenezuelanVietnameseWelshWest IndianYakamaYaquiYugoslavianYumanYup'ikZimbabwean
Immigration
NonimmigrantsImmigrantsAfghanistanAfricaAlbaniaArgentinaArmeniaAsiaAustraliaAustriaBahamasBangladeshBarbadosBelarusBelgiumBelizeBoliviaBosnia and HerzegovinaBrazilBulgariaBurma/MyanmarCabo VerdeCambodiaCameroonCanadaCaribbeanCentral AmericaChileChinaColombiaCongoCosta RicaCroatiaCubaCzechoslovakiaDenmarkDominicaDominican RepublicEastern AfricaEastern AsiaEastern EuropeEcuadorEgyptEl SalvadorEnglandEritreaEthiopiaEuropeFijiFranceGhanaGreeceGrenadaGuatemalaGuyanaHaitiHondurasHong KongHungaryIndiaIndonesiaIranIraqIrelandIsraelItalyJamaicaJapanJordanKazakhstanKenyaKoreaKuwaitLaosLatin AmericaLatviaLebanonLiberiaLithuaniaMalaysiaMexicoMicronesiaMiddle AfricaMoldovaMoroccoNepalNetherlandsNicaraguaNigeriaNorth AmericaNorth MacedoniaNorthern AfricaNorthern EuropeNorwayOceaniaPakistanPanamaPeruPhilippinesPolandPortugalRomaniaRussiaSaudi ArabiaScotlandSenegalSerbiaSierra LeoneSingaporeSomaliaSouth AfricaSouth AmericaSouth Central AsiaSouth Eastern AsiaSouthern EuropeSpainSri LankaSt. Vincent and the GrenadinesSudanSwedenSwitzerlandSyriaTaiwanThailandTrinidad and TobagoTurkeyUgandaUkraineUruguayUzbekistanVenezuelaVietnamWest IndiesWestern AfricaWestern AsiaWestern EuropeYemenZaireZimbabweAzores
Self-Care Disability
Income
Poverty
Unemployment
Labor Participation
Family Structure
Vehicle Availability
Education Level
Disability

Immigrants from Germany Self-Care Disability
Poor

2.5%
SELF-CARE DISABILITY
17.9/ 100
METRIC RATING
194th/ 347
METRIC RANK

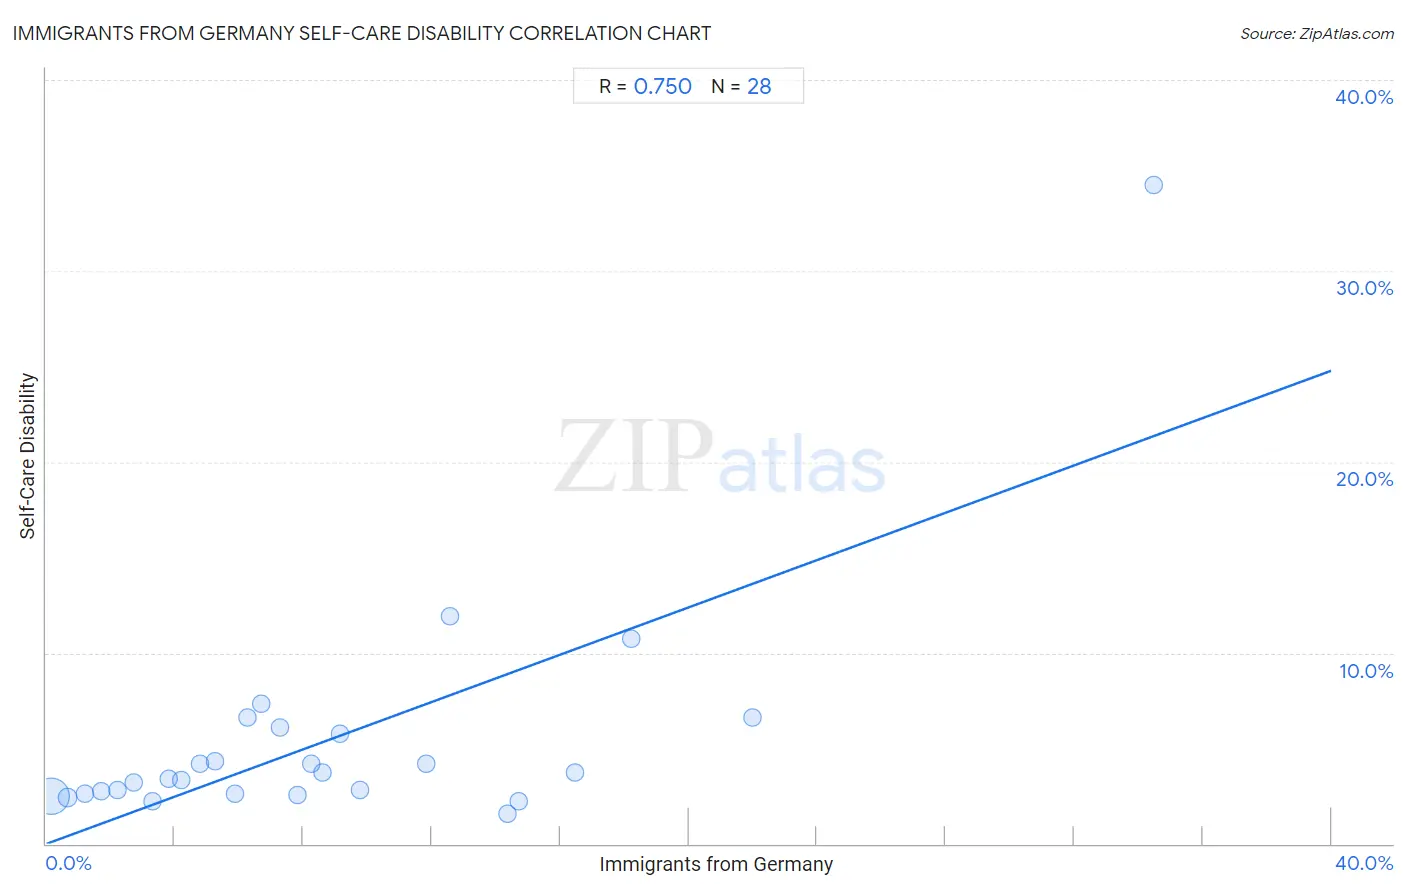
Immigrants from Germany Self-Care Disability Correlation Chart

The statistical analysis conducted on geographies consisting of 463,338,664 people shows a strong positive correlation between the proportion of Immigrants from Germany and percentage of population with self-care disability in the United States with a correlation coefficient (R) of 0.750 and weighted average of 2.5%. On average, for every 1% (one percent) increase in Immigrants from Germany within a typical geography, there is an increase of 0.62% in percentage of population with self-care disability.
Immigrants from Germany Self-Care Disability
It is essential to understand that the correlation between the percentage of Immigrants from Germany and percentage of population with self-care disability does not imply a direct cause-and-effect relationship. It remains uncertain whether the presence of Immigrants from Germany influences an upward or downward trend in the level of percentage of population with self-care disability within an area, or if Immigrants from Germany simply ended up residing in those areas with higher or lower levels of percentage of population with self-care disability due to other factors.

Demographics Similar to Immigrants from Germany by Self-Care Disability

In terms of self-care disability, the demographic groups most similar to Immigrants from Germany are Immigrants from Southern Europe (2.5%, a difference of 0.19%), Korean (2.5%, a difference of 0.20%), Crow (2.5%, a difference of 0.23%), Immigrants (2.5%, a difference of 0.25%), and Ukrainian (2.5%, a difference of 0.26%).
DemographicsRating | RankSelf-Care Disability
Irish
28.7
/100
|
#187
Fair
2.5%
Immigrants from Oceania
28.3
/100
|
#188
Fair
2.5%
Immigrants from Eastern Europe
28.0
/100
|
#189
Fair
2.5%
Sioux
24.6
/100
|
#190
Fair
2.5%
Moroccans
22.9
/100
|
#191
Fair
2.5%
Soviet Union
22.2
/100
|
#192
Fair
2.5%
Ukrainians
21.4
/100
|
#193
Fair
2.5%
Immigrants from Germany
17.9
/100
|
#194
Poor
2.5%
Immigrants from Southern Europe
15.6
/100
|
#195
Poor
2.5%
Koreans
15.5
/100
|
#196
Poor
2.5%
Crow
15.2
/100
|
#197
Poor
2.5%
Immigrants
15.0
/100
|
#198
Poor
2.5%
Immigrants from Ghana
14.7
/100
|
#199
Poor
2.5%
Immigrants from Western Africa
13.3
/100
|
#200
Poor
2.5%
Immigrants from South Eastern Asia
12.9
/100
|
#201
Poor
2.5%

Immigrants from Germany Self-Care Disability Correlation Summary

MeasurementImmigrants from Germany DataSelf-Care Disability Data
Minimum0.16%1.6%
Maximum34.5%34.5%
Range34.3%32.9%
Mean8.7%5.4%
Median7.0%3.6%
Interquartile 25% (IQ1)3.6%2.6%
Interquartile 75% (IQ3)12.2%5.9%
Interquartile Range (IQR)8.6%3.3%
Standard Deviation (Sample)7.5%6.2%
Standard Deviation (Population)7.4%6.1%

Correlation Details

Immigrants from Germany PercentileSample SizeSelf-Care Disability
[
0.0%
-
0.5%
]
0.16%
431,285,9202.5%
[
0.5%
-
1.0%
]
0.66%
26,877,7292.4%
[
1.0%
-
1.5%
]
1.19%
3,530,1102.6%
[
1.5%
-
2.0%
]
1.71%
919,3392.8%
[
2.0%
-
2.5%
]
2.21%
333,2012.8%
[
2.5%
-
3.0%
]
2.71%
191,9643.2%
[
3.0%
-
3.5%
]
3.30%
75,1602.2%
[
3.5%
-
4.0%
]
3.82%
25,9053.4%
[
4.0%
-
4.5%
]
4.21%
27,5693.4%
[
4.5%
-
5.0%
]
4.78%
18,7674.2%
[
5.0%
-
5.5%
]
5.25%
22,0314.3%
[
5.5%
-
6.0%
]
5.87%
5,8792.6%
[
6.0%
-
6.5%
]
6.26%
2,3486.6%
[
6.5%
-
7.0%
]
6.70%
1,0007.3%
[
7.0%
-
7.5%
]
7.29%
5,1016.1%
[
7.5%
-
8.0%
]
7.83%
4,7902.6%
[
8.0%
-
8.5%
]
8.24%
1,3234.2%
[
8.5%
-
9.0%
]
8.61%
7,6293.8%
[
9.0%
-
9.5%
]
9.16%
1315.7%
[
9.5%
-
10.0%
]
9.77%
2152.8%
[
11.5%
-
12.0%
]
11.81%
1274.2%
[
12.5%
-
13.0%
]
12.55%
50211.9%
[
14.0%
-
14.5%
]
14.36%
2021.6%
[
14.5%
-
15.0%
]
14.71%
1362.2%
[
16.0%
-
16.5%
]
16.47%
6073.7%
[
18.0%
-
18.5%
]
18.19%
83010.7%
[
21.5%
-
22.0%
]
21.98%
916.6%
[
34.0%
-
34.5%
]
34.48%
5834.5%