Immigrants from Germany 4 or more Vehicles in Household

COMPARE

Immigrants from Germany
Race
Ancestry
AfghanAfricanAlaska NativeAlaskan AthabascanAlbanianAleutAlsatianAmericanApacheArabArapahoArgentineanArmenianAssyrian/Chaldean/SyriacAustralianAustrianBahamianBangladeshiBarbadianBasqueBelgianBelizeanBermudanBhutaneseBlackfeetBolivianBrazilianBritishBritish West IndianBulgarianBurmeseCajunCambodianCanadianCape VerdeanCarpatho RusynCelticCentral AmericanCentral American IndianCherokeeCheyenneChickasawChileanChineseChippewaChoctawColombianColvilleComancheCosta RicanCreeCreekCroatianCrowCubanCypriotCzechCzechoslovakianDanishDelawareDominicanDutchDutch West IndianEastern EuropeanEcuadorianEgyptianEnglishEstonianEthiopianEuropeanFijianFilipinoFinnishFrenchFrench American IndianFrench CanadianGermanGerman RussianGhanaianGreekGuamanian/ChamorroGuatemalanGuyaneseHaitianHmongHonduranHopiHoumaHungarianIcelanderIndian (Asian)IndonesianInupiatIranianIraqiIrishIroquoisIsraeliItalianJamaicanJapaneseJordanianKenyanKiowaKoreanLaotianLatvianLebaneseLiberianLithuanianLumbeeLuxembourgerMacedonianMalaysianMalteseMarshalleseMenomineeMexicanMexican American IndianMongolianMoroccanNative HawaiianNavajoNepaleseNew ZealanderNicaraguanNigerianNorthern EuropeanNorwegianOkinawanOsageOttawaPaiutePakistaniPalestinianPanamanianParaguayanPennsylvania GermanPeruvianPimaPolishPortuguesePotawatomiPuebloPuerto RicanPuget Sound SalishRomanianRussianSalvadoranSamoanScandinavianScotch-IrishScottishSeminoleSenegaleseSerbianShoshoneSierra LeoneanSiouxSlavicSlovakSloveneSomaliSouth AfricanSouth AmericanSouth American IndianSoviet UnionSpaniardSpanishSpanish AmericanSpanish American IndianSri LankanSubsaharan AfricanSudaneseSwedishSwissSyrianTaiwaneseThaiTlingit-HaidaTohono O'OdhamTonganTrinidadian and TobagonianTsimshianTurkishU.S. Virgin IslanderUgandanUkrainianUruguayanUteVenezuelanVietnameseWelshWest IndianYakamaYaquiYugoslavianYumanYup'ikZimbabwean
Immigration
NonimmigrantsImmigrantsAfghanistanAfricaAlbaniaArgentinaArmeniaAsiaAustraliaAustriaBahamasBangladeshBarbadosBelarusBelgiumBelizeBoliviaBosnia and HerzegovinaBrazilBulgariaBurma/MyanmarCabo VerdeCambodiaCameroonCanadaCaribbeanCentral AmericaChileChinaColombiaCongoCosta RicaCroatiaCubaCzechoslovakiaDenmarkDominicaDominican RepublicEastern AfricaEastern AsiaEastern EuropeEcuadorEgyptEl SalvadorEnglandEritreaEthiopiaEuropeFijiFranceGermanyGhanaGreeceGrenadaGuatemalaGuyanaHaitiHondurasHong KongHungaryIndiaIndonesiaIranIraqIrelandIsraelItalyJamaicaJapanJordanKazakhstanKenyaKoreaKuwaitLaosLatin AmericaLatviaLebanonLiberiaLithuaniaMalaysiaMexicoMicronesiaMiddle AfricaMoldovaMoroccoNepalNetherlandsNicaraguaNigeriaNorth AmericaNorth MacedoniaNorthern AfricaNorthern EuropeNorwayOceaniaPakistanPanamaPeruPhilippinesPolandPortugalRomaniaRussiaSaudi ArabiaScotlandSenegalSerbiaSierra LeoneSingaporeSomaliaSouth AfricaSouth AmericaSouth Central AsiaSouth Eastern AsiaSouthern EuropeSpainSri LankaSt. Vincent and the GrenadinesSudanSwedenSwitzerlandSyriaTaiwanThailandTrinidad and TobagoTurkeyUgandaUkraineUruguayUzbekistanVenezuelaVietnamWest IndiesWestern AfricaWestern AsiaWestern EuropeYemenZaireZimbabweAzores
Select to Compare
Race
Ancestry
AfghanAfricanAlaska NativeAlaskan AthabascanAlbanianAleutAlsatianAmericanApacheArabArapahoArgentineanArmenianAssyrian/Chaldean/SyriacAustralianAustrianBahamianBangladeshiBarbadianBasqueBelgianBelizeanBermudanBhutaneseBlackfeetBolivianBrazilianBritishBritish West IndianBulgarianBurmeseCajunCambodianCanadianCape VerdeanCarpatho RusynCelticCentral AmericanCentral American IndianCherokeeCheyenneChickasawChileanChineseChippewaChoctawColombianColvilleComancheCosta RicanCreeCreekCroatianCrowCubanCypriotCzechCzechoslovakianDanishDelawareDominicanDutchDutch West IndianEastern EuropeanEcuadorianEgyptianEnglishEstonianEthiopianEuropeanFijianFilipinoFinnishFrenchFrench American IndianFrench CanadianGermanGerman RussianGhanaianGreekGuamanian/ChamorroGuatemalanGuyaneseHaitianHmongHonduranHopiHoumaHungarianIcelanderIndian (Asian)IndonesianInupiatIranianIraqiIrishIroquoisIsraeliItalianJamaicanJapaneseJordanianKenyanKiowaKoreanLaotianLatvianLebaneseLiberianLithuanianLumbeeLuxembourgerMacedonianMalaysianMalteseMarshalleseMenomineeMexicanMexican American IndianMongolianMoroccanNative HawaiianNavajoNepaleseNew ZealanderNicaraguanNigerianNorthern EuropeanNorwegianOkinawanOsageOttawaPaiutePakistaniPalestinianPanamanianParaguayanPennsylvania GermanPeruvianPimaPolishPortuguesePotawatomiPuebloPuerto RicanPuget Sound SalishRomanianRussianSalvadoranSamoanScandinavianScotch-IrishScottishSeminoleSenegaleseSerbianShoshoneSierra LeoneanSiouxSlavicSlovakSloveneSomaliSouth AfricanSouth AmericanSouth American IndianSoviet UnionSpaniardSpanishSpanish AmericanSpanish American IndianSri LankanSubsaharan AfricanSudaneseSwedishSwissSyrianTaiwaneseThaiTlingit-HaidaTohono O'OdhamTonganTrinidadian and TobagonianTsimshianTurkishU.S. Virgin IslanderUgandanUkrainianUruguayanUteVenezuelanVietnameseWelshWest IndianYakamaYaquiYugoslavianYumanYup'ikZimbabwean
Immigration
NonimmigrantsImmigrantsAfghanistanAfricaAlbaniaArgentinaArmeniaAsiaAustraliaAustriaBahamasBangladeshBarbadosBelarusBelgiumBelizeBoliviaBosnia and HerzegovinaBrazilBulgariaBurma/MyanmarCabo VerdeCambodiaCameroonCanadaCaribbeanCentral AmericaChileChinaColombiaCongoCosta RicaCroatiaCubaCzechoslovakiaDenmarkDominicaDominican RepublicEastern AfricaEastern AsiaEastern EuropeEcuadorEgyptEl SalvadorEnglandEritreaEthiopiaEuropeFijiFranceGhanaGreeceGrenadaGuatemalaGuyanaHaitiHondurasHong KongHungaryIndiaIndonesiaIranIraqIrelandIsraelItalyJamaicaJapanJordanKazakhstanKenyaKoreaKuwaitLaosLatin AmericaLatviaLebanonLiberiaLithuaniaMalaysiaMexicoMicronesiaMiddle AfricaMoldovaMoroccoNepalNetherlandsNicaraguaNigeriaNorth AmericaNorth MacedoniaNorthern AfricaNorthern EuropeNorwayOceaniaPakistanPanamaPeruPhilippinesPolandPortugalRomaniaRussiaSaudi ArabiaScotlandSenegalSerbiaSierra LeoneSingaporeSomaliaSouth AfricaSouth AmericaSouth Central AsiaSouth Eastern AsiaSouthern EuropeSpainSri LankaSt. Vincent and the GrenadinesSudanSwedenSwitzerlandSyriaTaiwanThailandTrinidad and TobagoTurkeyUgandaUkraineUruguayUzbekistanVenezuelaVietnamWest IndiesWestern AfricaWestern AsiaWestern EuropeYemenZaireZimbabweAzores
4 or more Vehicles in Household
Income
Poverty
Unemployment
Labor Participation
Family Structure
Vehicle Availability
Education Level
Disability

Immigrants from Germany 4 or more Vehicles in Household
Exceptional

6.8%
4+ VEHICLES AVAILABLE
94.7/ 100
METRIC RATING
121st/ 347
METRIC RANK

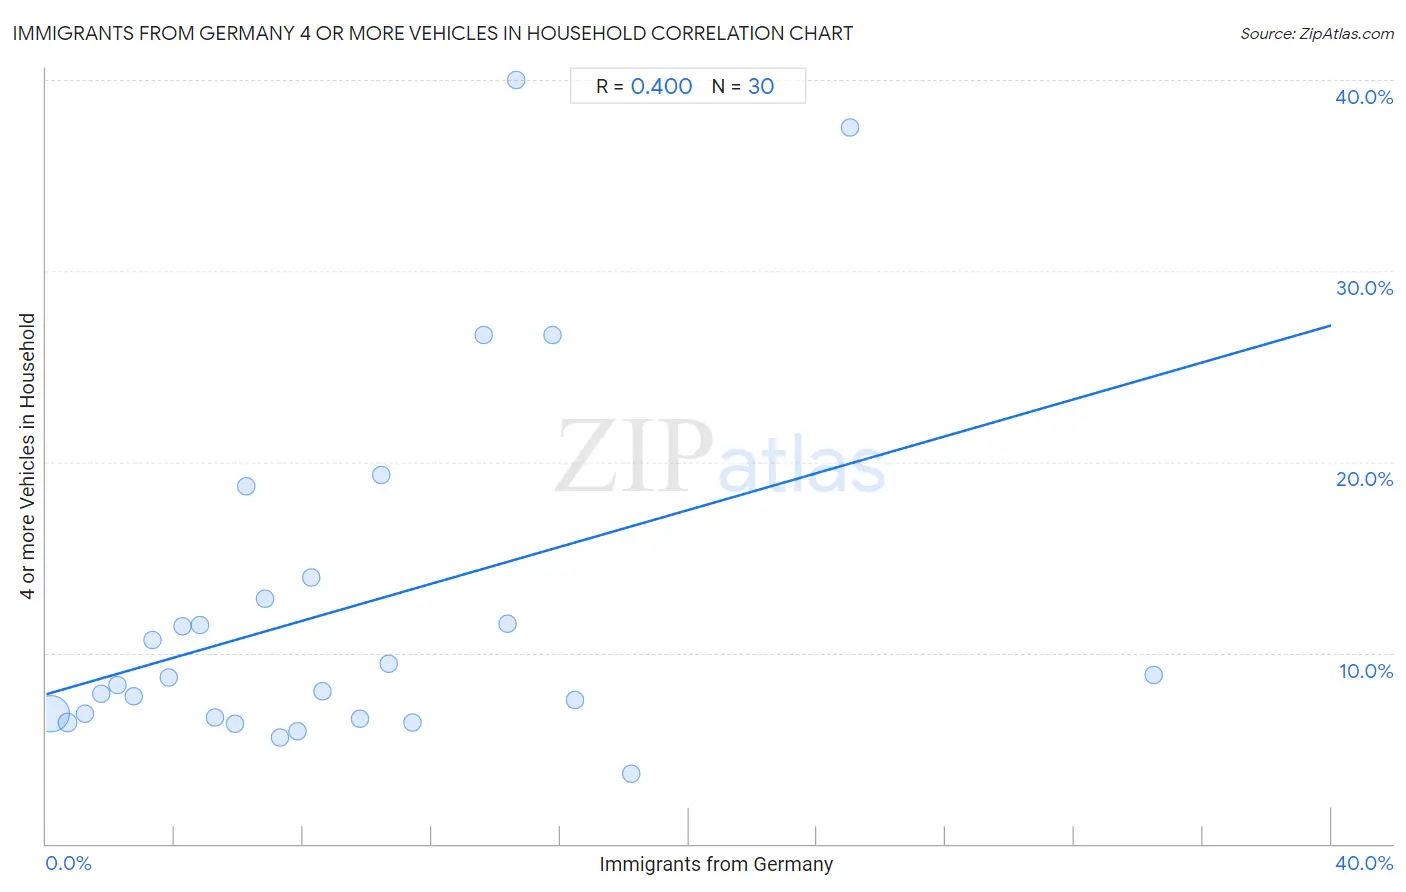
Immigrants from Germany 4 or more Vehicles in Household Correlation Chart

The statistical analysis conducted on geographies consisting of 462,058,551 people shows a mild positive correlation between the proportion of Immigrants from Germany and percentage of households with 4 or more vehicles available in the United States with a correlation coefficient (R) of 0.400 and weighted average of 6.8%. On average, for every 1% (one percent) increase in Immigrants from Germany within a typical geography, there is an increase of 0.48% in percentage of households with 4 or more vehicles available.
Immigrants from Germany 4 or more Vehicles in Household
It is essential to understand that the correlation between the percentage of Immigrants from Germany and percentage of households with 4 or more vehicles available does not imply a direct cause-and-effect relationship. It remains uncertain whether the presence of Immigrants from Germany influences an upward or downward trend in the level of percentage of households with 4 or more vehicles available within an area, or if Immigrants from Germany simply ended up residing in those areas with higher or lower levels of percentage of households with 4 or more vehicles available due to other factors.

Demographics Similar to Immigrants from Germany by 4 or more Vehicles in Household

In terms of 4 or more vehicles in household, the demographic groups most similar to Immigrants from Germany are Immigrants from Nicaragua (6.8%, a difference of 0.0%), Comanche (6.8%, a difference of 0.060%), Immigrants (6.8%, a difference of 0.070%), Immigrants from Asia (6.8%, a difference of 0.16%), and Austrian (6.8%, a difference of 0.26%).
DemographicsRating | Rank4 or more Vehicles in Household
Bolivians
96.3
/100
|
#114
Exceptional
6.8%
Tlingit-Haida
96.2
/100
|
#115
Exceptional
6.8%
Immigrants from Guatemala
95.8
/100
|
#116
Exceptional
6.8%
Burmese
95.7
/100
|
#117
Exceptional
6.8%
French American Indians
95.7
/100
|
#118
Exceptional
6.8%
Costa Ricans
95.5
/100
|
#119
Exceptional
6.8%
Comanche
94.8
/100
|
#120
Exceptional
6.8%
Immigrants from Germany
94.7
/100
|
#121
Exceptional
6.8%
Immigrants from Nicaragua
94.7
/100
|
#122
Exceptional
6.8%
Immigrants
94.6
/100
|
#123
Exceptional
6.8%
Immigrants from Asia
94.4
/100
|
#124
Exceptional
6.8%
Austrians
94.1
/100
|
#125
Exceptional
6.8%
Belgians
94.1
/100
|
#126
Exceptional
6.8%
Immigrants from Korea
93.8
/100
|
#127
Exceptional
6.8%
Immigrants from Bolivia
92.5
/100
|
#128
Exceptional
6.7%

Immigrants from Germany 4 or more Vehicles in Household Correlation Summary

MeasurementImmigrants from Germany Data4 or more Vehicles in Household Data
Minimum0.16%3.7%
Maximum34.5%40.0%
Range34.3%36.3%
Mean9.2%12.3%
Median7.5%8.5%
Interquartile 25% (IQ1)3.8%6.6%
Interquartile 75% (IQ3)13.6%12.8%
Interquartile Range (IQR)9.8%6.2%
Standard Deviation (Sample)7.6%9.2%
Standard Deviation (Population)7.5%9.0%

Correlation Details

Immigrants from Germany PercentileSample Size4 or more Vehicles in Household
[
0.0%
-
0.5%
]
0.16%
430,278,8856.8%
[
0.5%
-
1.0%
]
0.66%
26,681,3536.4%
[
1.0%
-
1.5%
]
1.19%
3,461,8236.8%
[
1.5%
-
2.0%
]
1.71%
897,1117.9%
[
2.0%
-
2.5%
]
2.21%
317,9648.3%
[
2.5%
-
3.0%
]
2.71%
201,6917.7%
[
3.0%
-
3.5%
]
3.30%
80,40410.7%
[
3.5%
-
4.0%
]
3.80%
30,1498.7%
[
4.0%
-
4.5%
]
4.22%
29,05611.4%
[
4.5%
-
5.0%
]
4.77%
20,06111.5%
[
5.0%
-
5.5%
]
5.25%
22,8176.6%
[
5.5%
-
6.0%
]
5.87%
6,8816.3%
[
6.0%
-
6.5%
]
6.24%
2,75518.7%
[
6.5%
-
7.0%
]
6.82%
2,87412.8%
[
7.0%
-
7.5%
]
7.27%
6,2905.6%
[
7.5%
-
8.0%
]
7.81%
5,0345.9%
[
8.0%
-
8.5%
]
8.24%
1,87013.9%
[
8.5%
-
9.0%
]
8.61%
7,4818.0%
[
9.5%
-
10.0%
]
9.78%
3176.5%
[
10.0%
-
10.5%
]
10.42%
1,07519.3%
[
10.5%
-
11.0%
]
10.67%
1509.4%
[
11.0%
-
11.5%
]
11.39%
4396.3%
[
13.5%
-
14.0%
]
13.64%
4426.7%
[
14.0%
-
14.5%
]
14.36%
20211.5%
[
14.5%
-
15.0%
]
14.63%
4140.0%
[
15.5%
-
16.0%
]
15.75%
27326.7%
[
16.0%
-
16.5%
]
16.47%
6077.5%
[
18.0%
-
18.5%
]
18.19%
8303.7%
[
25.0%
-
25.5%
]
25.00%
1637.5%
[
34.0%
-
34.5%
]
34.48%
588.8%