Immigrants from Ethiopia Married-Couple Family Poverty
COMPARE
Immigrants from Ethiopia
Select to Compare
Married-Couple Family Poverty
Immigrants from Ethiopia Married-Couple Family Poverty
5.1%
POVERTY | MARRIED-COUPLE FAMILIES
72.4/ 100
METRIC RATING
155th/ 347
METRIC RANK
Immigrants from Ethiopia Married-Couple Family Poverty Correlation Chart
The statistical analysis conducted on geographies consisting of 210,673,890 people shows a poor positive correlation between the proportion of Immigrants from Ethiopia and poverty level among married-couple families in the United States with a correlation coefficient (R) of 0.165 and weighted average of 5.1%. On average, for every 1% (one percent) increase in Immigrants from Ethiopia within a typical geography, there is an increase of 0.21% in poverty level among married-couple families.
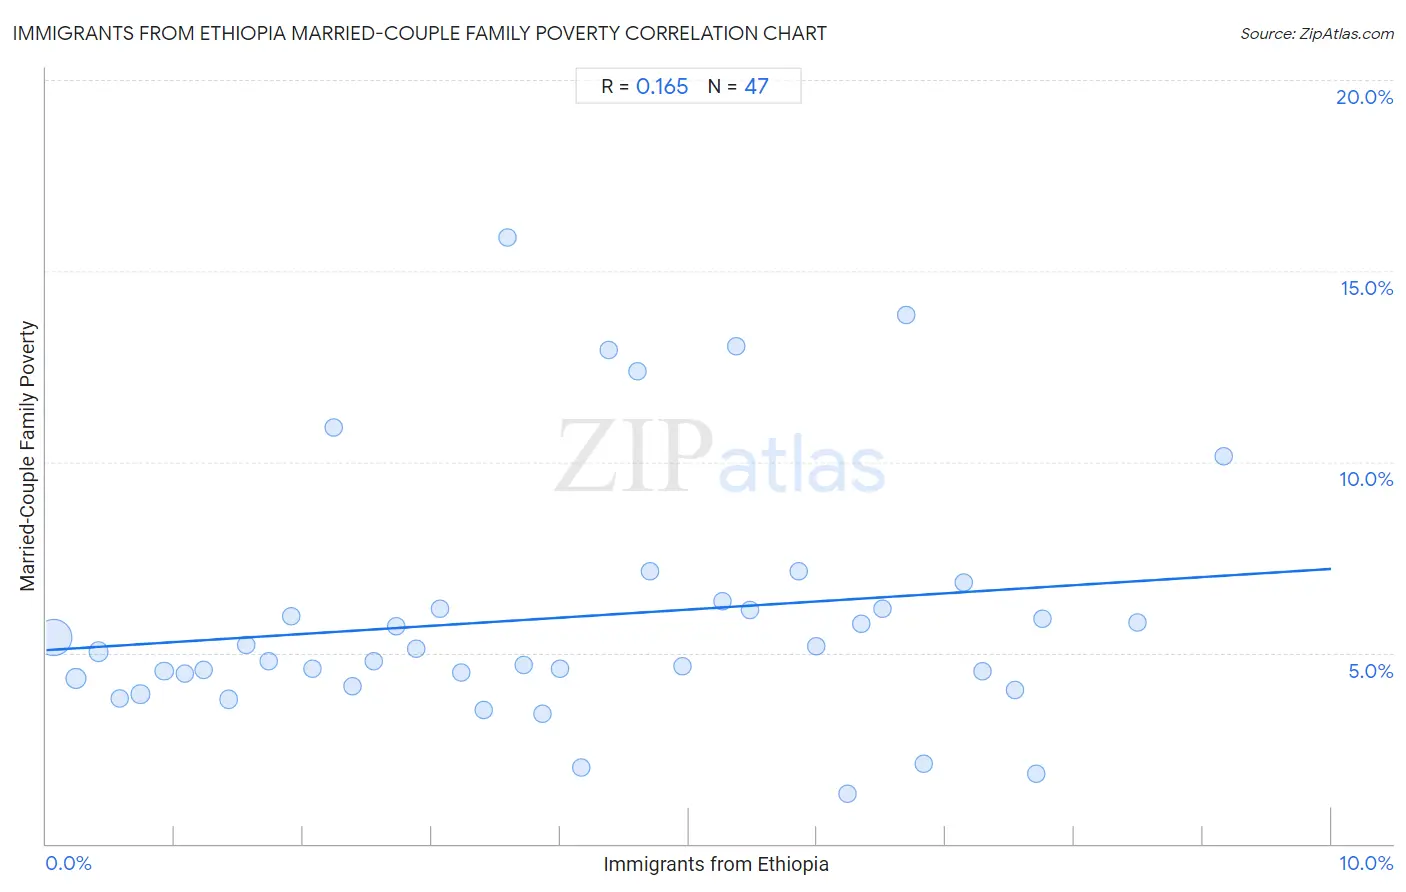
It is essential to understand that the correlation between the percentage of Immigrants from Ethiopia and poverty level among married-couple families does not imply a direct cause-and-effect relationship. It remains uncertain whether the presence of Immigrants from Ethiopia influences an upward or downward trend in the level of poverty level among married-couple families within an area, or if Immigrants from Ethiopia simply ended up residing in those areas with higher or lower levels of poverty level among married-couple families due to other factors.
Demographics Similar to Immigrants from Ethiopia by Married-Couple Family Poverty
In terms of married-couple family poverty, the demographic groups most similar to Immigrants from Ethiopia are Sri Lankan (5.1%, a difference of 0.040%), Delaware (5.1%, a difference of 0.19%), Argentinean (5.1%, a difference of 0.26%), Immigrants from South Eastern Asia (5.1%, a difference of 0.31%), and Immigrants from Saudi Arabia (5.1%, a difference of 0.31%).
| Demographics | Rating | Rank | Married-Couple Family Poverty |
| Immigrants from Russia | 78.7 /100 | #148 | Good 5.0% |
| Immigrants from Oceania | 78.6 /100 | #149 | Good 5.0% |
| Brazilians | 78.3 /100 | #150 | Good 5.0% |
| Immigrants from Cameroon | 77.3 /100 | #151 | Good 5.0% |
| Albanians | 77.2 /100 | #152 | Good 5.0% |
| Immigrants from Kuwait | 76.3 /100 | #153 | Good 5.0% |
| Delaware | 73.7 /100 | #154 | Good 5.1% |
| Immigrants from Ethiopia | 72.4 /100 | #155 | Good 5.1% |
| Sri Lankans | 72.2 /100 | #156 | Good 5.1% |
| Argentineans | 70.7 /100 | #157 | Good 5.1% |
| Immigrants from South Eastern Asia | 70.4 /100 | #158 | Good 5.1% |
| Immigrants from Saudi Arabia | 70.3 /100 | #159 | Good 5.1% |
| Pennsylvania Germans | 68.5 /100 | #160 | Good 5.1% |
| Ethiopians | 68.1 /100 | #161 | Good 5.1% |
| Immigrants from Jordan | 66.5 /100 | #162 | Good 5.1% |
Immigrants from Ethiopia Married-Couple Family Poverty Correlation Summary
| Measurement | Immigrants from Ethiopia Data | Married-Couple Family Poverty Data |
| Minimum | 0.061% | 1.3% |
| Maximum | 9.2% | 15.9% |
| Range | 9.1% | 14.6% |
| Mean | 4.0% | 5.9% |
| Median | 3.9% | 5.0% |
| Interquartile 25% (IQ1) | 1.9% | 4.3% |
| Interquartile 75% (IQ3) | 6.2% | 6.2% |
| Interquartile Range (IQR) | 4.3% | 1.8% |
| Standard Deviation (Sample) | 2.5% | 3.2% |
| Standard Deviation (Population) | 2.5% | 3.2% |
Correlation Details
| Immigrants from Ethiopia Percentile | Sample Size | Married-Couple Family Poverty |
[ 0.0% - 0.5% ] 0.061% | 150,353,739 | 5.4% |
[ 0.0% - 0.5% ] 0.23% | 25,043,847 | 4.3% |
[ 0.0% - 0.5% ] 0.41% | 13,283,888 | 5.0% |
[ 0.5% - 1.0% ] 0.57% | 4,663,676 | 3.8% |
[ 0.5% - 1.0% ] 0.73% | 3,388,726 | 3.9% |
[ 0.5% - 1.0% ] 0.92% | 2,582,395 | 4.5% |
[ 1.0% - 1.5% ] 1.08% | 2,674,428 | 4.5% |
[ 1.0% - 1.5% ] 1.23% | 1,575,933 | 4.6% |
[ 1.0% - 1.5% ] 1.42% | 1,246,209 | 3.8% |
[ 1.5% - 2.0% ] 1.56% | 987,685 | 5.2% |
[ 1.5% - 2.0% ] 1.73% | 715,164 | 4.8% |
[ 1.5% - 2.0% ] 1.91% | 440,195 | 6.0% |
[ 2.0% - 2.5% ] 2.07% | 329,899 | 4.6% |
[ 2.0% - 2.5% ] 2.23% | 193,113 | 10.9% |
[ 2.0% - 2.5% ] 2.38% | 224,147 | 4.1% |
[ 2.5% - 3.0% ] 2.55% | 249,512 | 4.8% |
[ 2.5% - 3.0% ] 2.72% | 404,656 | 5.7% |
[ 2.5% - 3.0% ] 2.88% | 295,400 | 5.1% |
[ 3.0% - 3.5% ] 3.06% | 210,684 | 6.2% |
[ 3.0% - 3.5% ] 3.23% | 165,509 | 4.5% |
[ 3.0% - 3.5% ] 3.40% | 105,961 | 3.5% |
[ 3.5% - 4.0% ] 3.59% | 62,723 | 15.9% |
[ 3.5% - 4.0% ] 3.71% | 163,783 | 4.7% |
[ 3.5% - 4.0% ] 3.86% | 263,076 | 3.4% |
[ 4.0% - 4.5% ] 4.00% | 86,662 | 4.6% |
[ 4.0% - 4.5% ] 4.16% | 33,847 | 2.0% |
[ 4.0% - 4.5% ] 4.37% | 4,161 | 12.9% |
[ 4.5% - 5.0% ] 4.60% | 70,113 | 12.4% |
[ 4.5% - 5.0% ] 4.70% | 75,806 | 7.1% |
[ 4.5% - 5.0% ] 4.95% | 4,023 | 4.6% |
[ 5.0% - 5.5% ] 5.26% | 25,324 | 6.4% |
[ 5.0% - 5.5% ] 5.37% | 29,132 | 13.0% |
[ 5.0% - 5.5% ] 5.48% | 11,209 | 6.1% |
[ 5.5% - 6.0% ] 5.85% | 97,661 | 7.1% |
[ 5.5% - 6.0% ] 5.99% | 152,984 | 5.2% |
[ 6.0% - 6.5% ] 6.24% | 4,425 | 1.3% |
[ 6.0% - 6.5% ] 6.35% | 56,737 | 5.8% |
[ 6.5% - 7.0% ] 6.51% | 81,808 | 6.2% |
[ 6.5% - 7.0% ] 6.69% | 73,292 | 13.9% |
[ 6.5% - 7.0% ] 6.83% | 19,812 | 2.1% |
[ 7.0% - 7.5% ] 7.14% | 75,534 | 6.8% |
[ 7.0% - 7.5% ] 7.28% | 30,927 | 4.5% |
[ 7.5% - 8.0% ] 7.54% | 17,542 | 4.0% |
[ 7.5% - 8.0% ] 7.71% | 27,523 | 1.8% |
[ 7.5% - 8.0% ] 7.75% | 37,207 | 5.9% |
[ 8.0% - 8.5% ] 8.50% | 18,324 | 5.8% |
[ 9.0% - 9.5% ] 9.17% | 15,489 | 10.1% |