Immigrants from Ethiopia Married-couple Households

COMPARE

Immigrants from Ethiopia
Race
Ancestry
AfghanAfricanAlaska NativeAlaskan AthabascanAlbanianAleutAlsatianAmericanApacheArabArapahoArgentineanArmenianAssyrian/Chaldean/SyriacAustralianAustrianBahamianBangladeshiBarbadianBasqueBelgianBelizeanBermudanBhutaneseBlackfeetBolivianBrazilianBritishBritish West IndianBulgarianBurmeseCajunCambodianCanadianCape VerdeanCarpatho RusynCelticCentral AmericanCentral American IndianCherokeeCheyenneChickasawChileanChineseChippewaChoctawColombianColvilleComancheCosta RicanCreeCreekCroatianCrowCubanCypriotCzechCzechoslovakianDanishDelawareDominicanDutchDutch West IndianEastern EuropeanEcuadorianEgyptianEnglishEstonianEthiopianEuropeanFijianFilipinoFinnishFrenchFrench American IndianFrench CanadianGermanGerman RussianGhanaianGreekGuamanian/ChamorroGuatemalanGuyaneseHaitianHmongHonduranHopiHoumaHungarianIcelanderIndian (Asian)IndonesianInupiatIranianIraqiIrishIroquoisIsraeliItalianJamaicanJapaneseJordanianKenyanKiowaKoreanLaotianLatvianLebaneseLiberianLithuanianLumbeeLuxembourgerMacedonianMalaysianMalteseMarshalleseMenomineeMexicanMexican American IndianMongolianMoroccanNative HawaiianNavajoNepaleseNew ZealanderNicaraguanNigerianNorthern EuropeanNorwegianOkinawanOsageOttawaPaiutePakistaniPalestinianPanamanianParaguayanPennsylvania GermanPeruvianPimaPolishPortuguesePotawatomiPuebloPuerto RicanPuget Sound SalishRomanianRussianSalvadoranSamoanScandinavianScotch-IrishScottishSeminoleSenegaleseSerbianShoshoneSierra LeoneanSiouxSlavicSlovakSloveneSomaliSouth AfricanSouth AmericanSouth American IndianSoviet UnionSpaniardSpanishSpanish AmericanSpanish American IndianSri LankanSubsaharan AfricanSudaneseSwedishSwissSyrianTaiwaneseThaiTlingit-HaidaTohono O'OdhamTonganTrinidadian and TobagonianTsimshianTurkishU.S. Virgin IslanderUgandanUkrainianUruguayanUteVenezuelanVietnameseWelshWest IndianYakamaYaquiYugoslavianYumanYup'ikZimbabwean
Immigration
NonimmigrantsImmigrantsAfghanistanAfricaAlbaniaArgentinaArmeniaAsiaAustraliaAustriaBahamasBangladeshBarbadosBelarusBelgiumBelizeBoliviaBosnia and HerzegovinaBrazilBulgariaBurma/MyanmarCabo VerdeCambodiaCameroonCanadaCaribbeanCentral AmericaChileChinaColombiaCongoCosta RicaCroatiaCubaCzechoslovakiaDenmarkDominicaDominican RepublicEastern AfricaEastern AsiaEastern EuropeEcuadorEgyptEl SalvadorEnglandEritreaEthiopiaEuropeFijiFranceGermanyGhanaGreeceGrenadaGuatemalaGuyanaHaitiHondurasHong KongHungaryIndiaIndonesiaIranIraqIrelandIsraelItalyJamaicaJapanJordanKazakhstanKenyaKoreaKuwaitLaosLatin AmericaLatviaLebanonLiberiaLithuaniaMalaysiaMexicoMicronesiaMiddle AfricaMoldovaMoroccoNepalNetherlandsNicaraguaNigeriaNorth AmericaNorth MacedoniaNorthern AfricaNorthern EuropeNorwayOceaniaPakistanPanamaPeruPhilippinesPolandPortugalRomaniaRussiaSaudi ArabiaScotlandSenegalSerbiaSierra LeoneSingaporeSomaliaSouth AfricaSouth AmericaSouth Central AsiaSouth Eastern AsiaSouthern EuropeSpainSri LankaSt. Vincent and the GrenadinesSudanSwedenSwitzerlandSyriaTaiwanThailandTrinidad and TobagoTurkeyUgandaUkraineUruguayUzbekistanVenezuelaVietnamWest IndiesWestern AfricaWestern AsiaWestern EuropeYemenZaireZimbabweAzores
Select to Compare
Race
Ancestry
AfghanAfricanAlaska NativeAlaskan AthabascanAlbanianAleutAlsatianAmericanApacheArabArapahoArgentineanArmenianAssyrian/Chaldean/SyriacAustralianAustrianBahamianBangladeshiBarbadianBasqueBelgianBelizeanBermudanBhutaneseBlackfeetBolivianBrazilianBritishBritish West IndianBulgarianBurmeseCajunCambodianCanadianCape VerdeanCarpatho RusynCelticCentral AmericanCentral American IndianCherokeeCheyenneChickasawChileanChineseChippewaChoctawColombianColvilleComancheCosta RicanCreeCreekCroatianCrowCubanCypriotCzechCzechoslovakianDanishDelawareDominicanDutchDutch West IndianEastern EuropeanEcuadorianEgyptianEnglishEstonianEthiopianEuropeanFijianFilipinoFinnishFrenchFrench American IndianFrench CanadianGermanGerman RussianGhanaianGreekGuamanian/ChamorroGuatemalanGuyaneseHaitianHmongHonduranHopiHoumaHungarianIcelanderIndian (Asian)IndonesianInupiatIranianIraqiIrishIroquoisIsraeliItalianJamaicanJapaneseJordanianKenyanKiowaKoreanLaotianLatvianLebaneseLiberianLithuanianLumbeeLuxembourgerMacedonianMalaysianMalteseMarshalleseMenomineeMexicanMexican American IndianMongolianMoroccanNative HawaiianNavajoNepaleseNew ZealanderNicaraguanNigerianNorthern EuropeanNorwegianOkinawanOsageOttawaPaiutePakistaniPalestinianPanamanianParaguayanPennsylvania GermanPeruvianPimaPolishPortuguesePotawatomiPuebloPuerto RicanPuget Sound SalishRomanianRussianSalvadoranSamoanScandinavianScotch-IrishScottishSeminoleSenegaleseSerbianShoshoneSierra LeoneanSiouxSlavicSlovakSloveneSomaliSouth AfricanSouth AmericanSouth American IndianSoviet UnionSpaniardSpanishSpanish AmericanSpanish American IndianSri LankanSubsaharan AfricanSudaneseSwedishSwissSyrianTaiwaneseThaiTlingit-HaidaTohono O'OdhamTonganTrinidadian and TobagonianTsimshianTurkishU.S. Virgin IslanderUgandanUkrainianUruguayanUteVenezuelanVietnameseWelshWest IndianYakamaYaquiYugoslavianYumanYup'ikZimbabwean
Immigration
NonimmigrantsImmigrantsAfghanistanAfricaAlbaniaArgentinaArmeniaAsiaAustraliaAustriaBahamasBangladeshBarbadosBelarusBelgiumBelizeBoliviaBosnia and HerzegovinaBrazilBulgariaBurma/MyanmarCabo VerdeCambodiaCameroonCanadaCaribbeanCentral AmericaChileChinaColombiaCongoCosta RicaCroatiaCubaCzechoslovakiaDenmarkDominicaDominican RepublicEastern AfricaEastern AsiaEastern EuropeEcuadorEgyptEl SalvadorEnglandEritreaEuropeFijiFranceGermanyGhanaGreeceGrenadaGuatemalaGuyanaHaitiHondurasHong KongHungaryIndiaIndonesiaIranIraqIrelandIsraelItalyJamaicaJapanJordanKazakhstanKenyaKoreaKuwaitLaosLatin AmericaLatviaLebanonLiberiaLithuaniaMalaysiaMexicoMicronesiaMiddle AfricaMoldovaMoroccoNepalNetherlandsNicaraguaNigeriaNorth AmericaNorth MacedoniaNorthern AfricaNorthern EuropeNorwayOceaniaPakistanPanamaPeruPhilippinesPolandPortugalRomaniaRussiaSaudi ArabiaScotlandSenegalSerbiaSierra LeoneSingaporeSomaliaSouth AfricaSouth AmericaSouth Central AsiaSouth Eastern AsiaSouthern EuropeSpainSri LankaSt. Vincent and the GrenadinesSudanSwedenSwitzerlandSyriaTaiwanThailandTrinidad and TobagoTurkeyUgandaUkraineUruguayUzbekistanVenezuelaVietnamWest IndiesWestern AfricaWestern AsiaWestern EuropeYemenZaireZimbabweAzores
Married-couple Households
Income
Poverty
Unemployment
Labor Participation
Family Structure
Vehicle Availability
Education Level
Disability

Immigrants from Ethiopia Married-couple Households
Tragic

43.1%
MARRIED-COUPLE HOUSEHOLDS
0.0/ 100
METRIC RATING
276th/ 347
METRIC RANK

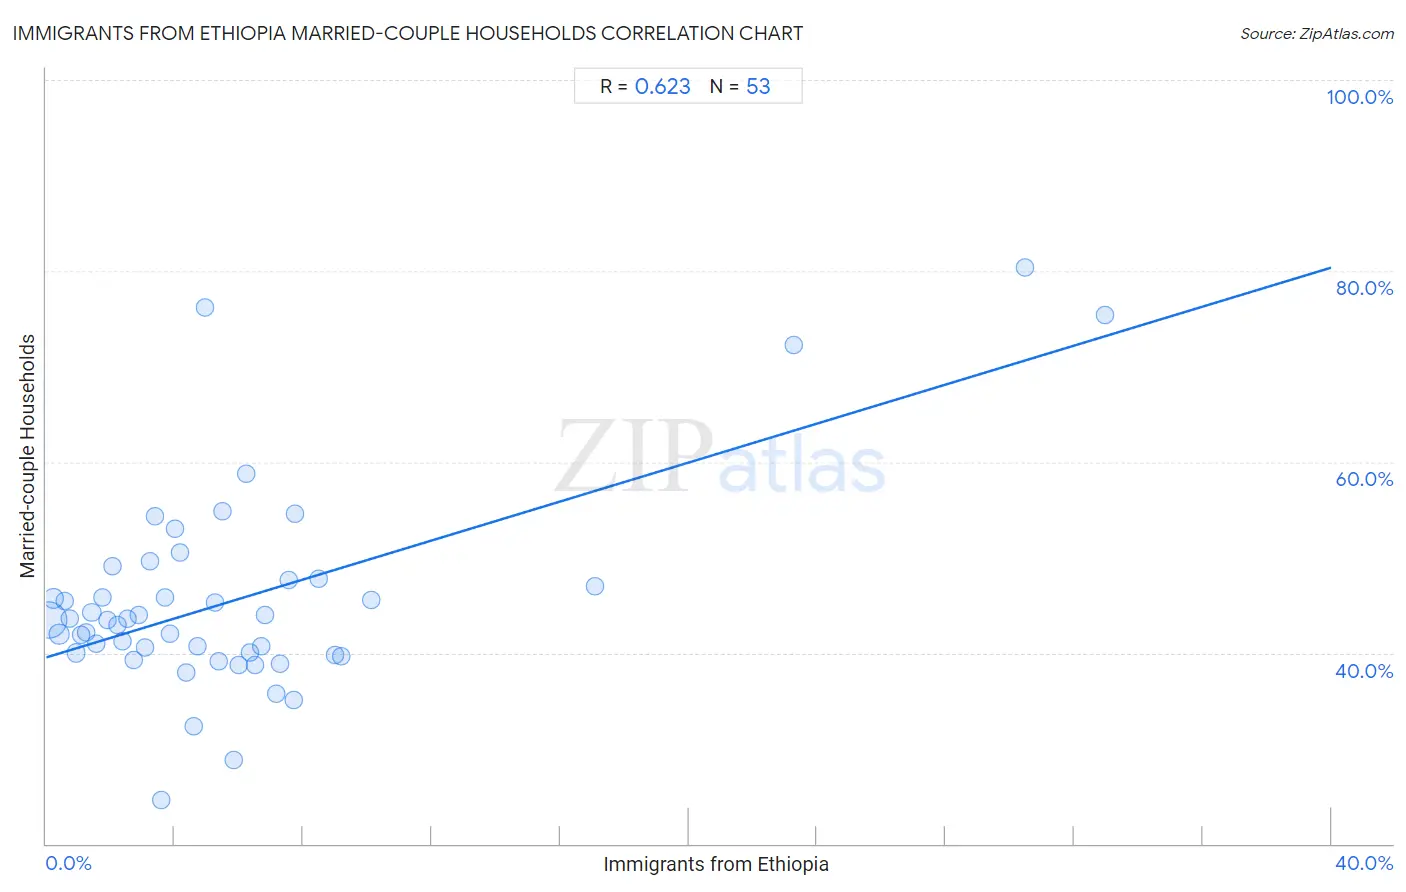
Immigrants from Ethiopia Married-couple Households Correlation Chart

The statistical analysis conducted on geographies consisting of 211,463,279 people shows a significant positive correlation between the proportion of Immigrants from Ethiopia and percentage of married-couple family households in the United States with a correlation coefficient (R) of 0.623 and weighted average of 43.1%. On average, for every 1% (one percent) increase in Immigrants from Ethiopia within a typical geography, there is an increase of 1.0% in percentage of married-couple family households.
Immigrants from Ethiopia Married-couple Households
It is essential to understand that the correlation between the percentage of Immigrants from Ethiopia and percentage of married-couple family households does not imply a direct cause-and-effect relationship. It remains uncertain whether the presence of Immigrants from Ethiopia influences an upward or downward trend in the level of percentage of married-couple family households within an area, or if Immigrants from Ethiopia simply ended up residing in those areas with higher or lower levels of percentage of married-couple family households due to other factors.

Demographics Similar to Immigrants from Ethiopia by Married-couple Households

In terms of married-couple households, the demographic groups most similar to Immigrants from Ethiopia are Immigrants from Bangladesh (43.1%, a difference of 0.11%), Nigerian (43.2%, a difference of 0.25%), Ethiopian (43.2%, a difference of 0.26%), Immigrants from Eastern Africa (42.9%, a difference of 0.26%), and Immigrants from Nigeria (43.2%, a difference of 0.36%).
DemographicsRating | RankMarried-couple Households
Immigrants from Sierra Leone
0.1
/100
|
#269
Tragic
43.3%
Yuman
0.1
/100
|
#270
Tragic
43.3%
Guatemalans
0.1
/100
|
#271
Tragic
43.3%
Immigrants from Nigeria
0.1
/100
|
#272
Tragic
43.2%
Ethiopians
0.1
/100
|
#273
Tragic
43.2%
Nigerians
0.1
/100
|
#274
Tragic
43.2%
Immigrants from Bangladesh
0.0
/100
|
#275
Tragic
43.1%
Immigrants from Ethiopia
0.0
/100
|
#276
Tragic
43.1%
Immigrants from Eastern Africa
0.0
/100
|
#277
Tragic
42.9%
Immigrants from Africa
0.0
/100
|
#278
Tragic
42.9%
Sierra Leoneans
0.0
/100
|
#279
Tragic
42.9%
Immigrants from Ecuador
0.0
/100
|
#280
Tragic
42.9%
Immigrants from Guatemala
0.0
/100
|
#281
Tragic
42.8%
Bermudans
0.0
/100
|
#282
Tragic
42.4%
Inupiat
0.0
/100
|
#283
Tragic
42.4%

Immigrants from Ethiopia Married-couple Households Correlation Summary

MeasurementImmigrants from Ethiopia DataMarried-couple Households Data
Minimum0.061%24.6%
Maximum33.0%80.4%
Range32.9%55.7%
Mean5.9%45.5%
Median4.4%43.5%
Interquartile 25% (IQ1)2.2%39.9%
Interquartile 75% (IQ3)7.0%47.7%
Interquartile Range (IQR)4.8%7.8%
Standard Deviation (Sample)6.6%10.7%
Standard Deviation (Population)6.5%10.6%

Correlation Details

Immigrants from Ethiopia PercentileSample SizeMarried-couple Households
[
0.0%
-
0.5%
]
0.061%
150,614,22243.5%
[
0.0%
-
0.5%
]
0.23%
25,206,29045.7%
[
0.0%
-
0.5%
]
0.41%
13,374,20542.0%
[
0.5%
-
1.0%
]
0.57%
4,751,41345.4%
[
0.5%
-
1.0%
]
0.73%
3,447,00343.6%
[
0.5%
-
1.0%
]
0.92%
2,593,44340.0%
[
1.0%
-
1.5%
]
1.08%
2,698,21441.9%
[
1.0%
-
1.5%
]
1.23%
1,602,87642.2%
[
1.0%
-
1.5%
]
1.42%
1,248,86644.2%
[
1.5%
-
2.0%
]
1.56%
987,68540.9%
[
1.5%
-
2.0%
]
1.73%
717,15945.8%
[
1.5%
-
2.0%
]
1.91%
440,30243.4%
[
2.0%
-
2.5%
]
2.07%
336,75849.1%
[
2.0%
-
2.5%
]
2.23%
200,03442.9%
[
2.0%
-
2.5%
]
2.38%
224,27641.2%
[
2.5%
-
3.0%
]
2.55%
255,76643.6%
[
2.5%
-
3.0%
]
2.72%
405,74039.2%
[
2.5%
-
3.0%
]
2.88%
295,67543.9%
[
3.0%
-
3.5%
]
3.06%
219,63240.5%
[
3.0%
-
3.5%
]
3.23%
166,43949.6%
[
3.0%
-
3.5%
]
3.40%
110,22954.3%
[
3.5%
-
4.0%
]
3.59%
62,72324.6%
[
3.5%
-
4.0%
]
3.71%
164,18345.7%
[
3.5%
-
4.0%
]
3.86%
263,07642.0%
[
4.0%
-
4.5%
]
4.00%
86,66253.0%
[
4.0%
-
4.5%
]
4.16%
33,84750.5%
[
4.0%
-
4.5%
]
4.37%
4,16138.0%
[
4.5%
-
5.0%
]
4.60%
73,07432.3%
[
4.5%
-
5.0%
]
4.70%
75,80640.6%
[
4.5%
-
5.0%
]
4.95%
4,02376.1%
[
5.0%
-
5.5%
]
5.26%
25,32445.2%
[
5.0%
-
5.5%
]
5.37%
29,13239.1%
[
5.0%
-
5.5%
]
5.48%
11,71654.9%
[
5.5%
-
6.0%
]
5.85%
97,66128.8%
[
5.5%
-
6.0%
]
5.99%
152,98438.7%
[
6.0%
-
6.5%
]
6.24%
4,76358.7%
[
6.0%
-
6.5%
]
6.35%
56,73740.1%
[
6.5%
-
7.0%
]
6.51%
81,80838.8%
[
6.5%
-
7.0%
]
6.69%
73,29240.7%
[
6.5%
-
7.0%
]
6.82%
23,50544.0%
[
7.0%
-
7.5%
]
7.14%
75,53435.7%
[
7.0%
-
7.5%
]
7.28%
30,92738.8%
[
7.5%
-
8.0%
]
7.54%
17,54247.6%
[
7.5%
-
8.0%
]
7.71%
27,52335.1%
[
7.5%
-
8.0%
]
7.75%
37,20754.6%
[
8.0%
-
8.5%
]
8.50%
18,32447.7%
[
8.5%
-
9.0%
]
8.97%
53539.8%
[
9.0%
-
9.5%
]
9.17%
15,48939.6%
[
10.0%
-
10.5%
]
10.11%
14,55345.5%
[
17.0%
-
17.5%
]
17.07%
8246.9%
[
23.0%
-
23.5%
]
23.25%
4,57272.3%
[
30.0%
-
30.5%
]
30.48%
10580.4%
[
32.5%
-
33.0%
]
32.97%
18275.4%