Immigrants from Ethiopia Disability Age Under 5

COMPARE

Immigrants from Ethiopia
Race
Ancestry
AfghanAfricanAlaska NativeAlaskan AthabascanAlbanianAleutAlsatianAmericanApacheArabArapahoArgentineanArmenianAssyrian/Chaldean/SyriacAustralianAustrianBahamianBangladeshiBarbadianBasqueBelgianBelizeanBermudanBhutaneseBlackfeetBolivianBrazilianBritishBritish West IndianBulgarianBurmeseCajunCambodianCanadianCape VerdeanCarpatho RusynCelticCentral AmericanCentral American IndianCherokeeCheyenneChickasawChileanChineseChippewaChoctawColombianColvilleComancheCosta RicanCreeCreekCroatianCrowCubanCypriotCzechCzechoslovakianDanishDelawareDominicanDutchDutch West IndianEastern EuropeanEcuadorianEgyptianEnglishEstonianEthiopianEuropeanFijianFilipinoFinnishFrenchFrench American IndianFrench CanadianGermanGerman RussianGhanaianGreekGuamanian/ChamorroGuatemalanGuyaneseHaitianHmongHonduranHopiHoumaHungarianIcelanderIndian (Asian)IndonesianInupiatIranianIraqiIrishIroquoisIsraeliItalianJamaicanJapaneseJordanianKenyanKiowaKoreanLaotianLatvianLebaneseLiberianLithuanianLumbeeLuxembourgerMacedonianMalaysianMalteseMarshalleseMenomineeMexicanMexican American IndianMongolianMoroccanNative HawaiianNavajoNepaleseNew ZealanderNicaraguanNigerianNorthern EuropeanNorwegianOkinawanOsageOttawaPaiutePakistaniPalestinianPanamanianParaguayanPennsylvania GermanPeruvianPimaPolishPortuguesePotawatomiPuebloPuerto RicanPuget Sound SalishRomanianRussianSalvadoranSamoanScandinavianScotch-IrishScottishSeminoleSenegaleseSerbianShoshoneSierra LeoneanSiouxSlavicSlovakSloveneSomaliSouth AfricanSouth AmericanSouth American IndianSoviet UnionSpaniardSpanishSpanish AmericanSpanish American IndianSri LankanSubsaharan AfricanSudaneseSwedishSwissSyrianTaiwaneseThaiTlingit-HaidaTohono O'OdhamTonganTrinidadian and TobagonianTsimshianTurkishU.S. Virgin IslanderUgandanUkrainianUruguayanUteVenezuelanVietnameseWelshWest IndianYakamaYaquiYugoslavianYumanYup'ikZimbabwean
Immigration
NonimmigrantsImmigrantsAfghanistanAfricaAlbaniaArgentinaArmeniaAsiaAustraliaAustriaBahamasBangladeshBarbadosBelarusBelgiumBelizeBoliviaBosnia and HerzegovinaBrazilBulgariaBurma/MyanmarCabo VerdeCambodiaCameroonCanadaCaribbeanCentral AmericaChileChinaColombiaCongoCosta RicaCroatiaCubaCzechoslovakiaDenmarkDominicaDominican RepublicEastern AfricaEastern AsiaEastern EuropeEcuadorEgyptEl SalvadorEnglandEritreaEthiopiaEuropeFijiFranceGermanyGhanaGreeceGrenadaGuatemalaGuyanaHaitiHondurasHong KongHungaryIndiaIndonesiaIranIraqIrelandIsraelItalyJamaicaJapanJordanKazakhstanKenyaKoreaKuwaitLaosLatin AmericaLatviaLebanonLiberiaLithuaniaMalaysiaMexicoMicronesiaMiddle AfricaMoldovaMoroccoNepalNetherlandsNicaraguaNigeriaNorth AmericaNorth MacedoniaNorthern AfricaNorthern EuropeNorwayOceaniaPakistanPanamaPeruPhilippinesPolandPortugalRomaniaRussiaSaudi ArabiaScotlandSenegalSerbiaSierra LeoneSingaporeSomaliaSouth AfricaSouth AmericaSouth Central AsiaSouth Eastern AsiaSouthern EuropeSpainSri LankaSt. Vincent and the GrenadinesSudanSwedenSwitzerlandSyriaTaiwanThailandTrinidad and TobagoTurkeyUgandaUkraineUruguayUzbekistanVenezuelaVietnamWest IndiesWestern AfricaWestern AsiaWestern EuropeYemenZaireZimbabweAzores
Select to Compare
Race
Ancestry
AfghanAfricanAlaska NativeAlaskan AthabascanAlbanianAleutAlsatianAmericanApacheArabArapahoArgentineanArmenianAssyrian/Chaldean/SyriacAustralianAustrianBahamianBangladeshiBarbadianBasqueBelgianBelizeanBermudanBhutaneseBlackfeetBolivianBrazilianBritishBritish West IndianBulgarianBurmeseCajunCambodianCanadianCape VerdeanCarpatho RusynCelticCentral AmericanCentral American IndianCherokeeCheyenneChickasawChileanChineseChippewaChoctawColombianColvilleComancheCosta RicanCreeCreekCroatianCrowCubanCypriotCzechCzechoslovakianDanishDelawareDominicanDutchDutch West IndianEastern EuropeanEcuadorianEgyptianEnglishEstonianEthiopianEuropeanFijianFilipinoFinnishFrenchFrench American IndianFrench CanadianGermanGerman RussianGhanaianGreekGuamanian/ChamorroGuatemalanGuyaneseHaitianHmongHonduranHopiHoumaHungarianIcelanderIndian (Asian)IndonesianInupiatIranianIraqiIrishIroquoisIsraeliItalianJamaicanJapaneseJordanianKenyanKiowaKoreanLaotianLatvianLebaneseLiberianLithuanianLumbeeLuxembourgerMacedonianMalaysianMalteseMarshalleseMenomineeMexicanMexican American IndianMongolianMoroccanNative HawaiianNavajoNepaleseNew ZealanderNicaraguanNigerianNorthern EuropeanNorwegianOkinawanOsageOttawaPaiutePakistaniPalestinianPanamanianParaguayanPennsylvania GermanPeruvianPimaPolishPortuguesePotawatomiPuebloPuerto RicanPuget Sound SalishRomanianRussianSalvadoranSamoanScandinavianScotch-IrishScottishSeminoleSenegaleseSerbianShoshoneSierra LeoneanSiouxSlavicSlovakSloveneSomaliSouth AfricanSouth AmericanSouth American IndianSoviet UnionSpaniardSpanishSpanish AmericanSpanish American IndianSri LankanSubsaharan AfricanSudaneseSwedishSwissSyrianTaiwaneseThaiTlingit-HaidaTohono O'OdhamTonganTrinidadian and TobagonianTsimshianTurkishU.S. Virgin IslanderUgandanUkrainianUruguayanUteVenezuelanVietnameseWelshWest IndianYakamaYaquiYugoslavianYumanYup'ikZimbabwean
Immigration
NonimmigrantsImmigrantsAfghanistanAfricaAlbaniaArgentinaArmeniaAsiaAustraliaAustriaBahamasBangladeshBarbadosBelarusBelgiumBelizeBoliviaBosnia and HerzegovinaBrazilBulgariaBurma/MyanmarCabo VerdeCambodiaCameroonCanadaCaribbeanCentral AmericaChileChinaColombiaCongoCosta RicaCroatiaCubaCzechoslovakiaDenmarkDominicaDominican RepublicEastern AfricaEastern AsiaEastern EuropeEcuadorEgyptEl SalvadorEnglandEritreaEuropeFijiFranceGermanyGhanaGreeceGrenadaGuatemalaGuyanaHaitiHondurasHong KongHungaryIndiaIndonesiaIranIraqIrelandIsraelItalyJamaicaJapanJordanKazakhstanKenyaKoreaKuwaitLaosLatin AmericaLatviaLebanonLiberiaLithuaniaMalaysiaMexicoMicronesiaMiddle AfricaMoldovaMoroccoNepalNetherlandsNicaraguaNigeriaNorth AmericaNorth MacedoniaNorthern AfricaNorthern EuropeNorwayOceaniaPakistanPanamaPeruPhilippinesPolandPortugalRomaniaRussiaSaudi ArabiaScotlandSenegalSerbiaSierra LeoneSingaporeSomaliaSouth AfricaSouth AmericaSouth Central AsiaSouth Eastern AsiaSouthern EuropeSpainSri LankaSt. Vincent and the GrenadinesSudanSwedenSwitzerlandSyriaTaiwanThailandTrinidad and TobagoTurkeyUgandaUkraineUruguayUzbekistanVenezuelaVietnamWest IndiesWestern AfricaWestern AsiaWestern EuropeYemenZaireZimbabweAzores
Disability Age Under 5
Income
Poverty
Unemployment
Labor Participation
Family Structure
Vehicle Availability
Education Level
Disability

Immigrants from Ethiopia Disability Age Under 5
Exceptional

1.1%
DISABILITY | AGE UNDER 5
99.2/ 100
METRIC RATING
61st/ 347
METRIC RANK

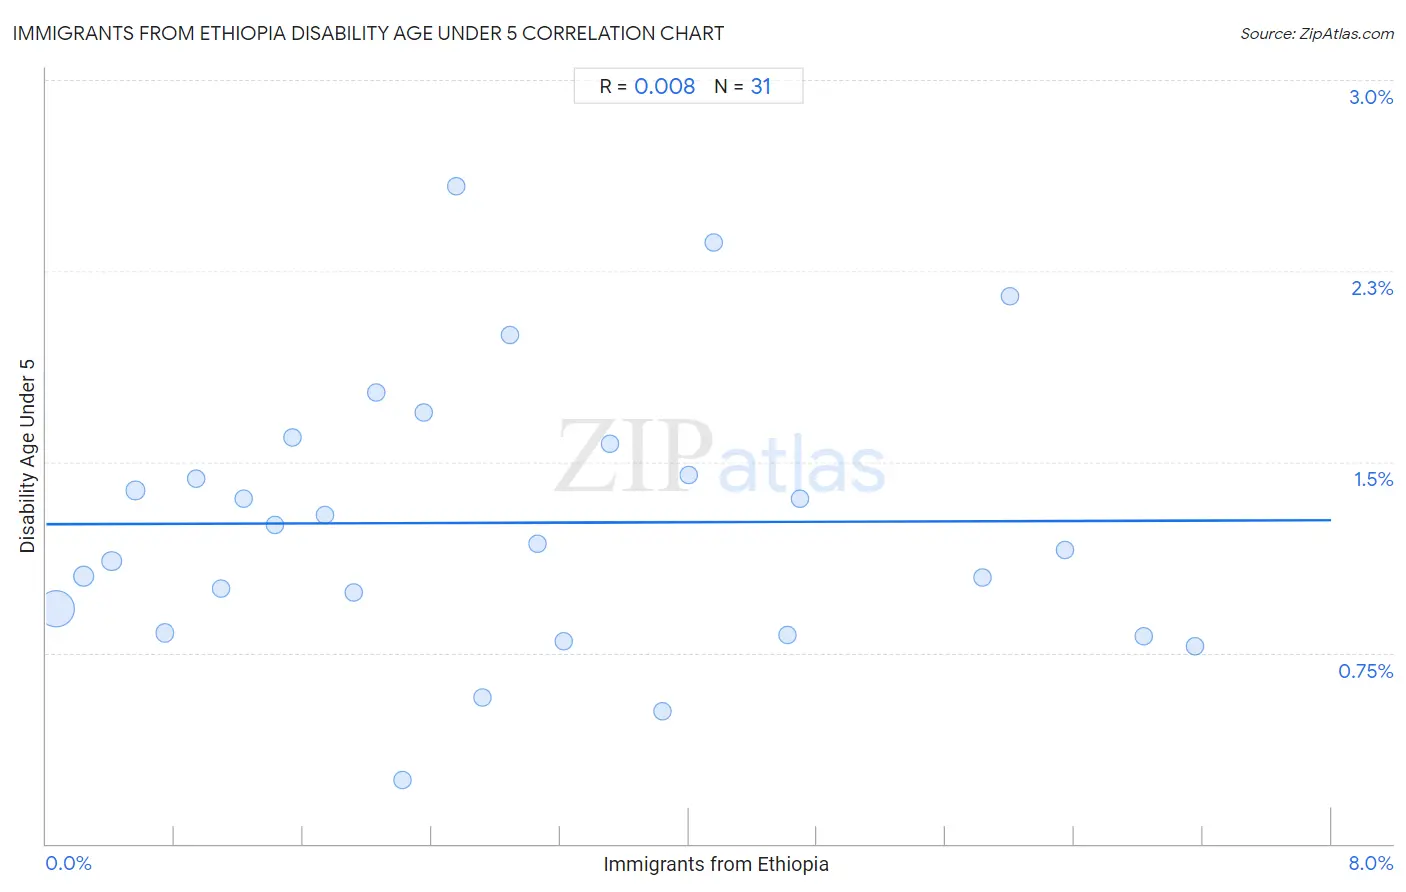
Immigrants from Ethiopia Disability Age Under 5 Correlation Chart

The statistical analysis conducted on geographies consisting of 138,545,864 people shows no correlation between the proportion of Immigrants from Ethiopia and percentage of population with a disability under the age of 5 in the United States with a correlation coefficient (R) of 0.008 and weighted average of 1.1%. On average, for every 1% (one percent) increase in Immigrants from Ethiopia within a typical geography, there is an increase of 0.0020% in percentage of population with a disability under the age of 5.
Immigrants from Ethiopia Disability Age Under 5
It is essential to understand that the correlation between the percentage of Immigrants from Ethiopia and percentage of population with a disability under the age of 5 does not imply a direct cause-and-effect relationship. It remains uncertain whether the presence of Immigrants from Ethiopia influences an upward or downward trend in the level of percentage of population with a disability under the age of 5 within an area, or if Immigrants from Ethiopia simply ended up residing in those areas with higher or lower levels of percentage of population with a disability under the age of 5 due to other factors.

Demographics Similar to Immigrants from Ethiopia by Disability Age Under 5

In terms of disability age under 5, the demographic groups most similar to Immigrants from Ethiopia are Immigrants from Switzerland (1.1%, a difference of 0.010%), Immigrants from Western Asia (1.1%, a difference of 0.060%), Immigrants from Vietnam (1.1%, a difference of 0.12%), Egyptian (1.1%, a difference of 0.58%), and Immigrants from Malaysia (1.1%, a difference of 0.82%).
DemographicsRating | RankDisability Age Under 5
Immigrants from El Salvador
99.6
/100
|
#54
Exceptional
1.1%
Salvadorans
99.5
/100
|
#55
Exceptional
1.1%
Ecuadorians
99.5
/100
|
#56
Exceptional
1.1%
Assyrians/Chaldeans/Syriacs
99.5
/100
|
#57
Exceptional
1.1%
Immigrants from Egypt
99.4
/100
|
#58
Exceptional
1.1%
Immigrants from Malaysia
99.4
/100
|
#59
Exceptional
1.1%
Immigrants from Western Asia
99.2
/100
|
#60
Exceptional
1.1%
Immigrants from Ethiopia
99.2
/100
|
#61
Exceptional
1.1%
Immigrants from Switzerland
99.2
/100
|
#62
Exceptional
1.1%
Immigrants from Vietnam
99.1
/100
|
#63
Exceptional
1.1%
Egyptians
98.9
/100
|
#64
Exceptional
1.1%
Immigrants from Korea
98.8
/100
|
#65
Exceptional
1.1%
Immigrants from Indonesia
98.7
/100
|
#66
Exceptional
1.1%
Immigrants from Belize
98.7
/100
|
#67
Exceptional
1.1%
South Africans
98.7
/100
|
#68
Exceptional
1.1%

Immigrants from Ethiopia Disability Age Under 5 Correlation Summary

MeasurementImmigrants from Ethiopia DataDisability Age Under 5 Data
Minimum0.060%0.25%
Maximum7.2%2.6%
Range7.1%2.3%
Mean2.9%1.3%
Median2.6%1.2%
Interquartile 25% (IQ1)1.2%0.83%
Interquartile 75% (IQ3)4.2%1.6%
Interquartile Range (IQR)2.9%0.74%
Standard Deviation (Sample)2.0%0.53%
Standard Deviation (Population)2.0%0.52%

Correlation Details

Immigrants from Ethiopia PercentileSample SizeDisability Age Under 5
[
0.0%
-
0.5%
]
0.060%
104,235,3280.92%
[
0.0%
-
0.5%
]
0.23%
14,352,1511.0%
[
0.0%
-
0.5%
]
0.41%
8,654,1901.1%
[
0.5%
-
1.0%
]
0.56%
2,039,4521.4%
[
0.5%
-
1.0%
]
0.74%
1,883,3440.83%
[
0.5%
-
1.0%
]
0.93%
1,131,8421.4%
[
1.0%
-
1.5%
]
1.09%
2,088,2001.0%
[
1.0%
-
1.5%
]
1.23%
813,1561.4%
[
1.0%
-
1.5%
]
1.42%
678,3431.3%
[
1.5%
-
2.0%
]
1.53%
530,1271.6%
[
1.5%
-
2.0%
]
1.73%
346,3401.3%
[
1.5%
-
2.0%
]
1.91%
136,5340.99%
[
2.0%
-
2.5%
]
2.05%
70,4591.8%
[
2.0%
-
2.5%
]
2.22%
97,0800.25%
[
2.0%
-
2.5%
]
2.35%
96,8411.7%
[
2.5%
-
3.0%
]
2.55%
85,5722.6%
[
2.5%
-
3.0%
]
2.72%
308,7630.57%
[
2.5%
-
3.0%
]
2.89%
162,2942.0%
[
3.0%
-
3.5%
]
3.06%
102,1851.2%
[
3.0%
-
3.5%
]
3.22%
109,2670.79%
[
3.5%
-
4.0%
]
3.51%
14,2121.6%
[
3.5%
-
4.0%
]
3.84%
193,3410.52%
[
3.5%
-
4.0%
]
4.00%
66,6681.4%
[
4.0%
-
4.5%
]
4.16%
28,6902.4%
[
4.5%
-
5.0%
]
4.61%
63,0470.82%
[
4.5%
-
5.0%
]
4.69%
51,3431.4%
[
5.5%
-
6.0%
]
5.83%
36,7241.0%
[
5.5%
-
6.0%
]
6.00%
81,3172.2%
[
6.0%
-
6.5%
]
6.34%
19,5311.2%
[
6.5%
-
7.0%
]
6.83%
19,8120.81%
[
7.0%
-
7.5%
]
7.15%
49,7110.78%