Immigrants from Ethiopia GED/Equivalency

COMPARE

Immigrants from Ethiopia
Race
Ancestry
AfghanAfricanAlaska NativeAlaskan AthabascanAlbanianAleutAlsatianAmericanApacheArabArapahoArgentineanArmenianAssyrian/Chaldean/SyriacAustralianAustrianBahamianBangladeshiBarbadianBasqueBelgianBelizeanBermudanBhutaneseBlackfeetBolivianBrazilianBritishBritish West IndianBulgarianBurmeseCajunCambodianCanadianCape VerdeanCarpatho RusynCelticCentral AmericanCentral American IndianCherokeeCheyenneChickasawChileanChineseChippewaChoctawColombianColvilleComancheCosta RicanCreeCreekCroatianCrowCubanCypriotCzechCzechoslovakianDanishDelawareDominicanDutchDutch West IndianEastern EuropeanEcuadorianEgyptianEnglishEstonianEthiopianEuropeanFijianFilipinoFinnishFrenchFrench American IndianFrench CanadianGermanGerman RussianGhanaianGreekGuamanian/ChamorroGuatemalanGuyaneseHaitianHmongHonduranHopiHoumaHungarianIcelanderIndian (Asian)IndonesianInupiatIranianIraqiIrishIroquoisIsraeliItalianJamaicanJapaneseJordanianKenyanKiowaKoreanLaotianLatvianLebaneseLiberianLithuanianLumbeeLuxembourgerMacedonianMalaysianMalteseMarshalleseMenomineeMexicanMexican American IndianMongolianMoroccanNative HawaiianNavajoNepaleseNew ZealanderNicaraguanNigerianNorthern EuropeanNorwegianOkinawanOsageOttawaPaiutePakistaniPalestinianPanamanianParaguayanPennsylvania GermanPeruvianPimaPolishPortuguesePotawatomiPuebloPuerto RicanPuget Sound SalishRomanianRussianSalvadoranSamoanScandinavianScotch-IrishScottishSeminoleSenegaleseSerbianShoshoneSierra LeoneanSiouxSlavicSlovakSloveneSomaliSouth AfricanSouth AmericanSouth American IndianSoviet UnionSpaniardSpanishSpanish AmericanSpanish American IndianSri LankanSubsaharan AfricanSudaneseSwedishSwissSyrianTaiwaneseThaiTlingit-HaidaTohono O'OdhamTonganTrinidadian and TobagonianTsimshianTurkishU.S. Virgin IslanderUgandanUkrainianUruguayanUteVenezuelanVietnameseWelshWest IndianYakamaYaquiYugoslavianYumanYup'ikZimbabwean
Immigration
NonimmigrantsImmigrantsAfghanistanAfricaAlbaniaArgentinaArmeniaAsiaAustraliaAustriaBahamasBangladeshBarbadosBelarusBelgiumBelizeBoliviaBosnia and HerzegovinaBrazilBulgariaBurma/MyanmarCabo VerdeCambodiaCameroonCanadaCaribbeanCentral AmericaChileChinaColombiaCongoCosta RicaCroatiaCubaCzechoslovakiaDenmarkDominicaDominican RepublicEastern AfricaEastern AsiaEastern EuropeEcuadorEgyptEl SalvadorEnglandEritreaEthiopiaEuropeFijiFranceGermanyGhanaGreeceGrenadaGuatemalaGuyanaHaitiHondurasHong KongHungaryIndiaIndonesiaIranIraqIrelandIsraelItalyJamaicaJapanJordanKazakhstanKenyaKoreaKuwaitLaosLatin AmericaLatviaLebanonLiberiaLithuaniaMalaysiaMexicoMicronesiaMiddle AfricaMoldovaMoroccoNepalNetherlandsNicaraguaNigeriaNorth AmericaNorth MacedoniaNorthern AfricaNorthern EuropeNorwayOceaniaPakistanPanamaPeruPhilippinesPolandPortugalRomaniaRussiaSaudi ArabiaScotlandSenegalSerbiaSierra LeoneSingaporeSomaliaSouth AfricaSouth AmericaSouth Central AsiaSouth Eastern AsiaSouthern EuropeSpainSri LankaSt. Vincent and the GrenadinesSudanSwedenSwitzerlandSyriaTaiwanThailandTrinidad and TobagoTurkeyUgandaUkraineUruguayUzbekistanVenezuelaVietnamWest IndiesWestern AfricaWestern AsiaWestern EuropeYemenZaireZimbabweAzores
Select to Compare
Race
Ancestry
AfghanAfricanAlaska NativeAlaskan AthabascanAlbanianAleutAlsatianAmericanApacheArabArapahoArgentineanArmenianAssyrian/Chaldean/SyriacAustralianAustrianBahamianBangladeshiBarbadianBasqueBelgianBelizeanBermudanBhutaneseBlackfeetBolivianBrazilianBritishBritish West IndianBulgarianBurmeseCajunCambodianCanadianCape VerdeanCarpatho RusynCelticCentral AmericanCentral American IndianCherokeeCheyenneChickasawChileanChineseChippewaChoctawColombianColvilleComancheCosta RicanCreeCreekCroatianCrowCubanCypriotCzechCzechoslovakianDanishDelawareDominicanDutchDutch West IndianEastern EuropeanEcuadorianEgyptianEnglishEstonianEthiopianEuropeanFijianFilipinoFinnishFrenchFrench American IndianFrench CanadianGermanGerman RussianGhanaianGreekGuamanian/ChamorroGuatemalanGuyaneseHaitianHmongHonduranHopiHoumaHungarianIcelanderIndian (Asian)IndonesianInupiatIranianIraqiIrishIroquoisIsraeliItalianJamaicanJapaneseJordanianKenyanKiowaKoreanLaotianLatvianLebaneseLiberianLithuanianLumbeeLuxembourgerMacedonianMalaysianMalteseMarshalleseMenomineeMexicanMexican American IndianMongolianMoroccanNative HawaiianNavajoNepaleseNew ZealanderNicaraguanNigerianNorthern EuropeanNorwegianOkinawanOsageOttawaPaiutePakistaniPalestinianPanamanianParaguayanPennsylvania GermanPeruvianPimaPolishPortuguesePotawatomiPuebloPuerto RicanPuget Sound SalishRomanianRussianSalvadoranSamoanScandinavianScotch-IrishScottishSeminoleSenegaleseSerbianShoshoneSierra LeoneanSiouxSlavicSlovakSloveneSomaliSouth AfricanSouth AmericanSouth American IndianSoviet UnionSpaniardSpanishSpanish AmericanSpanish American IndianSri LankanSubsaharan AfricanSudaneseSwedishSwissSyrianTaiwaneseThaiTlingit-HaidaTohono O'OdhamTonganTrinidadian and TobagonianTsimshianTurkishU.S. Virgin IslanderUgandanUkrainianUruguayanUteVenezuelanVietnameseWelshWest IndianYakamaYaquiYugoslavianYumanYup'ikZimbabwean
Immigration
NonimmigrantsImmigrantsAfghanistanAfricaAlbaniaArgentinaArmeniaAsiaAustraliaAustriaBahamasBangladeshBarbadosBelarusBelgiumBelizeBoliviaBosnia and HerzegovinaBrazilBulgariaBurma/MyanmarCabo VerdeCambodiaCameroonCanadaCaribbeanCentral AmericaChileChinaColombiaCongoCosta RicaCroatiaCubaCzechoslovakiaDenmarkDominicaDominican RepublicEastern AfricaEastern AsiaEastern EuropeEcuadorEgyptEl SalvadorEnglandEritreaEuropeFijiFranceGermanyGhanaGreeceGrenadaGuatemalaGuyanaHaitiHondurasHong KongHungaryIndiaIndonesiaIranIraqIrelandIsraelItalyJamaicaJapanJordanKazakhstanKenyaKoreaKuwaitLaosLatin AmericaLatviaLebanonLiberiaLithuaniaMalaysiaMexicoMicronesiaMiddle AfricaMoldovaMoroccoNepalNetherlandsNicaraguaNigeriaNorth AmericaNorth MacedoniaNorthern AfricaNorthern EuropeNorwayOceaniaPakistanPanamaPeruPhilippinesPolandPortugalRomaniaRussiaSaudi ArabiaScotlandSenegalSerbiaSierra LeoneSingaporeSomaliaSouth AfricaSouth AmericaSouth Central AsiaSouth Eastern AsiaSouthern EuropeSpainSri LankaSt. Vincent and the GrenadinesSudanSwedenSwitzerlandSyriaTaiwanThailandTrinidad and TobagoTurkeyUgandaUkraineUruguayUzbekistanVenezuelaVietnamWest IndiesWestern AfricaWestern AsiaWestern EuropeYemenZaireZimbabweAzores
GED/Equivalency
Income
Poverty
Unemployment
Labor Participation
Family Structure
Vehicle Availability
Education Level
Disability

Immigrants from Ethiopia GED/Equivalency
Good

86.0%
GED/EQUIVALENCY
61.2/ 100
METRIC RATING
169th/ 347
METRIC RANK

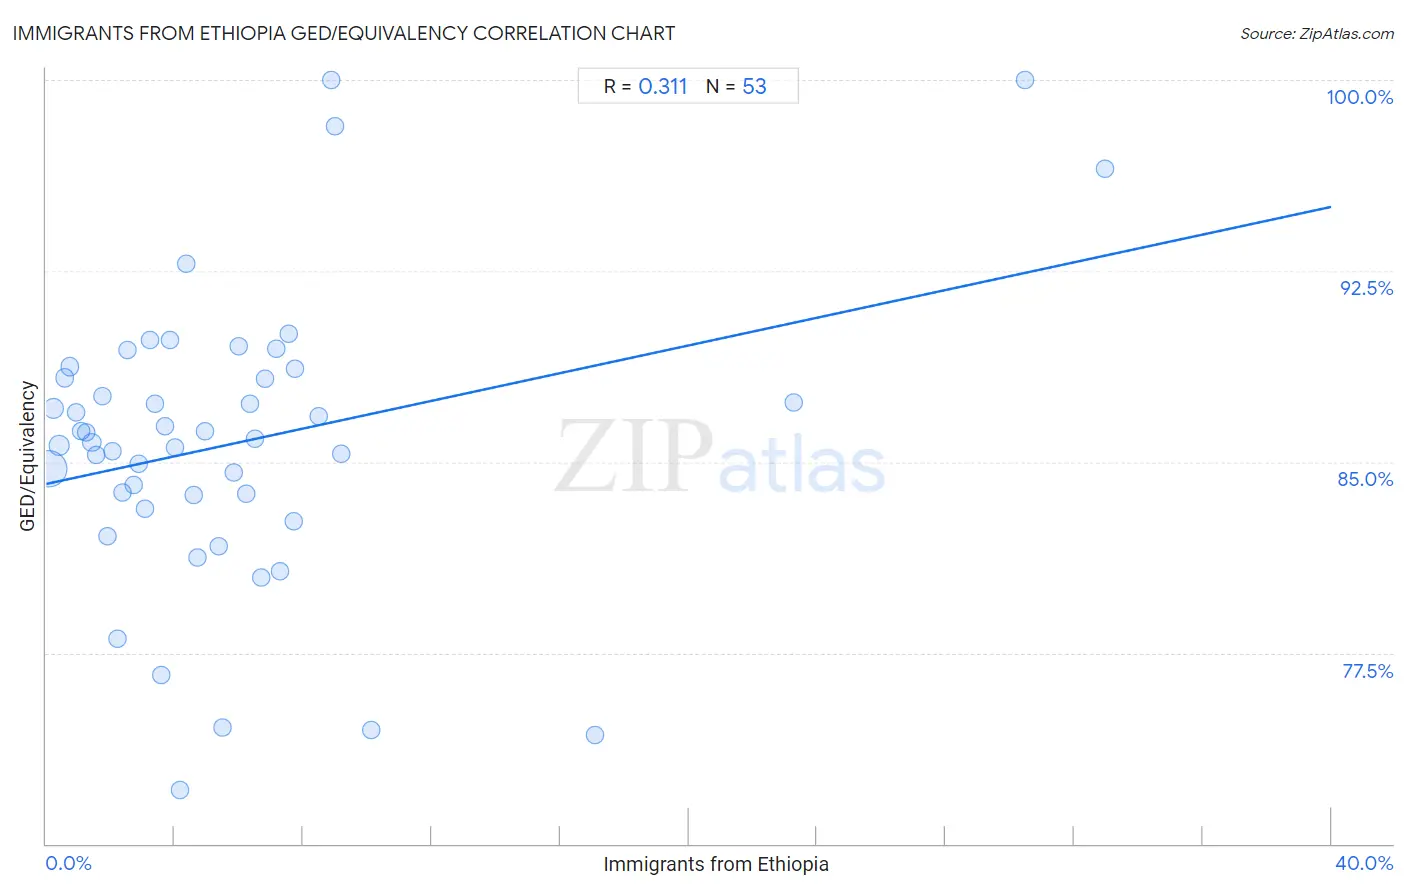
Immigrants from Ethiopia GED/Equivalency Correlation Chart

The statistical analysis conducted on geographies consisting of 211,528,629 people shows a mild positive correlation between the proportion of Immigrants from Ethiopia and percentage of population with at least ged/equivalency education in the United States with a correlation coefficient (R) of 0.311 and weighted average of 86.0%. On average, for every 1% (one percent) increase in Immigrants from Ethiopia within a typical geography, there is an increase of 0.27% in percentage of population with at least ged/equivalency education.
Immigrants from Ethiopia GED/Equivalency
It is essential to understand that the correlation between the percentage of Immigrants from Ethiopia and percentage of population with at least ged/equivalency education does not imply a direct cause-and-effect relationship. It remains uncertain whether the presence of Immigrants from Ethiopia influences an upward or downward trend in the level of percentage of population with at least ged/equivalency education within an area, or if Immigrants from Ethiopia simply ended up residing in those areas with higher or lower levels of percentage of population with at least ged/equivalency education due to other factors.

Demographics Similar to Immigrants from Ethiopia by GED/Equivalency

In terms of ged/equivalency, the demographic groups most similar to Immigrants from Ethiopia are Sierra Leonean (86.0%, a difference of 0.010%), Afghan (85.9%, a difference of 0.030%), Ethiopian (86.0%, a difference of 0.050%), Alsatian (86.0%, a difference of 0.070%), and Immigrants from Albania (86.0%, a difference of 0.070%).
DemographicsRating | RankGED/Equivalency
Immigrants from Iraq
68.1
/100
|
#162
Good
86.1%
Ugandans
66.3
/100
|
#163
Good
86.1%
Venezuelans
65.5
/100
|
#164
Good
86.0%
Alsatians
64.3
/100
|
#165
Good
86.0%
Immigrants from Albania
64.2
/100
|
#166
Good
86.0%
Ethiopians
63.7
/100
|
#167
Good
86.0%
Sierra Leoneans
61.8
/100
|
#168
Good
86.0%
Immigrants from Ethiopia
61.2
/100
|
#169
Good
86.0%
Afghans
59.7
/100
|
#170
Average
85.9%
Immigrants from Chile
57.3
/100
|
#171
Average
85.9%
Bermudans
55.1
/100
|
#172
Average
85.8%
Immigrants from Venezuela
50.7
/100
|
#173
Average
85.8%
Ottawa
50.0
/100
|
#174
Average
85.8%
Immigrants from Bolivia
49.8
/100
|
#175
Average
85.8%
Immigrants from Eastern Africa
47.7
/100
|
#176
Average
85.7%

Immigrants from Ethiopia GED/Equivalency Correlation Summary

MeasurementImmigrants from Ethiopia DataGED/Equivalency Data
Minimum0.061%72.1%
Maximum33.0%100.0%
Range32.9%27.9%
Mean6.0%85.8%
Median4.4%85.9%
Interquartile 25% (IQ1)2.2%83.4%
Interquartile 75% (IQ3)7.2%88.5%
Interquartile Range (IQR)5.1%5.0%
Standard Deviation (Sample)6.6%5.7%
Standard Deviation (Population)6.5%5.7%

Correlation Details

Immigrants from Ethiopia PercentileSample SizeGED/Equivalency
[
0.0%
-
0.5%
]
0.061%
150,639,20184.7%
[
0.0%
-
0.5%
]
0.23%
25,238,89687.1%
[
0.0%
-
0.5%
]
0.41%
13,388,43085.7%
[
0.5%
-
1.0%
]
0.57%
4,762,27888.3%
[
0.5%
-
1.0%
]
0.73%
3,450,65988.7%
[
0.5%
-
1.0%
]
0.92%
2,595,27687.0%
[
1.0%
-
1.5%
]
1.08%
2,698,68286.2%
[
1.0%
-
1.5%
]
1.23%
1,602,87686.2%
[
1.0%
-
1.5%
]
1.42%
1,248,86685.8%
[
1.5%
-
2.0%
]
1.56%
988,71285.3%
[
1.5%
-
2.0%
]
1.73%
717,15987.6%
[
1.5%
-
2.0%
]
1.91%
440,30282.1%
[
2.0%
-
2.5%
]
2.07%
337,18685.4%
[
2.0%
-
2.5%
]
2.23%
200,03478.0%
[
2.0%
-
2.5%
]
2.38%
224,27683.8%
[
2.5%
-
3.0%
]
2.55%
255,76689.4%
[
2.5%
-
3.0%
]
2.72%
405,74084.1%
[
2.5%
-
3.0%
]
2.88%
295,67584.9%
[
3.0%
-
3.5%
]
3.06%
219,63283.1%
[
3.0%
-
3.5%
]
3.23%
166,43989.8%
[
3.0%
-
3.5%
]
3.40%
110,22987.3%
[
3.5%
-
4.0%
]
3.59%
62,72376.6%
[
3.5%
-
4.0%
]
3.71%
164,18386.4%
[
3.5%
-
4.0%
]
3.86%
263,07689.8%
[
4.0%
-
4.5%
]
4.00%
86,66285.6%
[
4.0%
-
4.5%
]
4.16%
33,84772.1%
[
4.0%
-
4.5%
]
4.37%
4,16192.8%
[
4.5%
-
5.0%
]
4.60%
73,07483.7%
[
4.5%
-
5.0%
]
4.70%
75,80681.2%
[
4.5%
-
5.0%
]
4.95%
4,02386.2%
[
5.0%
-
5.5%
]
5.37%
29,13281.7%
[
5.0%
-
5.5%
]
5.48%
11,71674.6%
[
5.5%
-
6.0%
]
5.85%
97,66184.6%
[
5.5%
-
6.0%
]
5.99%
152,98489.6%
[
6.0%
-
6.5%
]
6.24%
4,76383.7%
[
6.0%
-
6.5%
]
6.35%
56,73787.3%
[
6.5%
-
7.0%
]
6.51%
81,80885.9%
[
6.5%
-
7.0%
]
6.69%
73,29280.5%
[
6.5%
-
7.0%
]
6.82%
23,50588.3%
[
7.0%
-
7.5%
]
7.14%
75,53489.4%
[
7.0%
-
7.5%
]
7.28%
30,92780.7%
[
7.5%
-
8.0%
]
7.54%
17,54290.0%
[
7.5%
-
8.0%
]
7.71%
27,52382.7%
[
7.5%
-
8.0%
]
7.75%
37,20788.6%
[
8.0%
-
8.5%
]
8.50%
18,32486.8%
[
8.5%
-
9.0%
]
8.86%
587100.0%
[
8.5%
-
9.0%
]
8.97%
53598.2%
[
9.0%
-
9.5%
]
9.17%
15,48985.3%
[
10.0%
-
10.5%
]
10.11%
14,55374.5%
[
17.0%
-
17.5%
]
17.07%
8274.3%
[
23.0%
-
23.5%
]
23.25%
4,57287.3%
[
30.0%
-
30.5%
]
30.48%
105100.0%
[
32.5%
-
33.0%
]
32.97%
18296.5%