Immigrants from Ethiopia 4 or more Vehicles in Household

COMPARE

Immigrants from Ethiopia
Race
Ancestry
AfghanAfricanAlaska NativeAlaskan AthabascanAlbanianAleutAlsatianAmericanApacheArabArapahoArgentineanArmenianAssyrian/Chaldean/SyriacAustralianAustrianBahamianBangladeshiBarbadianBasqueBelgianBelizeanBermudanBhutaneseBlackfeetBolivianBrazilianBritishBritish West IndianBulgarianBurmeseCajunCambodianCanadianCape VerdeanCarpatho RusynCelticCentral AmericanCentral American IndianCherokeeCheyenneChickasawChileanChineseChippewaChoctawColombianColvilleComancheCosta RicanCreeCreekCroatianCrowCubanCypriotCzechCzechoslovakianDanishDelawareDominicanDutchDutch West IndianEastern EuropeanEcuadorianEgyptianEnglishEstonianEthiopianEuropeanFijianFilipinoFinnishFrenchFrench American IndianFrench CanadianGermanGerman RussianGhanaianGreekGuamanian/ChamorroGuatemalanGuyaneseHaitianHmongHonduranHopiHoumaHungarianIcelanderIndian (Asian)IndonesianInupiatIranianIraqiIrishIroquoisIsraeliItalianJamaicanJapaneseJordanianKenyanKiowaKoreanLaotianLatvianLebaneseLiberianLithuanianLumbeeLuxembourgerMacedonianMalaysianMalteseMarshalleseMenomineeMexicanMexican American IndianMongolianMoroccanNative HawaiianNavajoNepaleseNew ZealanderNicaraguanNigerianNorthern EuropeanNorwegianOkinawanOsageOttawaPaiutePakistaniPalestinianPanamanianParaguayanPennsylvania GermanPeruvianPimaPolishPortuguesePotawatomiPuebloPuerto RicanPuget Sound SalishRomanianRussianSalvadoranSamoanScandinavianScotch-IrishScottishSeminoleSenegaleseSerbianShoshoneSierra LeoneanSiouxSlavicSlovakSloveneSomaliSouth AfricanSouth AmericanSouth American IndianSoviet UnionSpaniardSpanishSpanish AmericanSpanish American IndianSri LankanSubsaharan AfricanSudaneseSwedishSwissSyrianTaiwaneseThaiTlingit-HaidaTohono O'OdhamTonganTrinidadian and TobagonianTsimshianTurkishU.S. Virgin IslanderUgandanUkrainianUruguayanUteVenezuelanVietnameseWelshWest IndianYakamaYaquiYugoslavianYumanYup'ikZimbabwean
Immigration
NonimmigrantsImmigrantsAfghanistanAfricaAlbaniaArgentinaArmeniaAsiaAustraliaAustriaBahamasBangladeshBarbadosBelarusBelgiumBelizeBoliviaBosnia and HerzegovinaBrazilBulgariaBurma/MyanmarCabo VerdeCambodiaCameroonCanadaCaribbeanCentral AmericaChileChinaColombiaCongoCosta RicaCroatiaCubaCzechoslovakiaDenmarkDominicaDominican RepublicEastern AfricaEastern AsiaEastern EuropeEcuadorEgyptEl SalvadorEnglandEritreaEthiopiaEuropeFijiFranceGermanyGhanaGreeceGrenadaGuatemalaGuyanaHaitiHondurasHong KongHungaryIndiaIndonesiaIranIraqIrelandIsraelItalyJamaicaJapanJordanKazakhstanKenyaKoreaKuwaitLaosLatin AmericaLatviaLebanonLiberiaLithuaniaMalaysiaMexicoMicronesiaMiddle AfricaMoldovaMoroccoNepalNetherlandsNicaraguaNigeriaNorth AmericaNorth MacedoniaNorthern AfricaNorthern EuropeNorwayOceaniaPakistanPanamaPeruPhilippinesPolandPortugalRomaniaRussiaSaudi ArabiaScotlandSenegalSerbiaSierra LeoneSingaporeSomaliaSouth AfricaSouth AmericaSouth Central AsiaSouth Eastern AsiaSouthern EuropeSpainSri LankaSt. Vincent and the GrenadinesSudanSwedenSwitzerlandSyriaTaiwanThailandTrinidad and TobagoTurkeyUgandaUkraineUruguayUzbekistanVenezuelaVietnamWest IndiesWestern AfricaWestern AsiaWestern EuropeYemenZaireZimbabweAzores
Select to Compare
Race
Ancestry
AfghanAfricanAlaska NativeAlaskan AthabascanAlbanianAleutAlsatianAmericanApacheArabArapahoArgentineanArmenianAssyrian/Chaldean/SyriacAustralianAustrianBahamianBangladeshiBarbadianBasqueBelgianBelizeanBermudanBhutaneseBlackfeetBolivianBrazilianBritishBritish West IndianBulgarianBurmeseCajunCambodianCanadianCape VerdeanCarpatho RusynCelticCentral AmericanCentral American IndianCherokeeCheyenneChickasawChileanChineseChippewaChoctawColombianColvilleComancheCosta RicanCreeCreekCroatianCrowCubanCypriotCzechCzechoslovakianDanishDelawareDominicanDutchDutch West IndianEastern EuropeanEcuadorianEgyptianEnglishEstonianEthiopianEuropeanFijianFilipinoFinnishFrenchFrench American IndianFrench CanadianGermanGerman RussianGhanaianGreekGuamanian/ChamorroGuatemalanGuyaneseHaitianHmongHonduranHopiHoumaHungarianIcelanderIndian (Asian)IndonesianInupiatIranianIraqiIrishIroquoisIsraeliItalianJamaicanJapaneseJordanianKenyanKiowaKoreanLaotianLatvianLebaneseLiberianLithuanianLumbeeLuxembourgerMacedonianMalaysianMalteseMarshalleseMenomineeMexicanMexican American IndianMongolianMoroccanNative HawaiianNavajoNepaleseNew ZealanderNicaraguanNigerianNorthern EuropeanNorwegianOkinawanOsageOttawaPaiutePakistaniPalestinianPanamanianParaguayanPennsylvania GermanPeruvianPimaPolishPortuguesePotawatomiPuebloPuerto RicanPuget Sound SalishRomanianRussianSalvadoranSamoanScandinavianScotch-IrishScottishSeminoleSenegaleseSerbianShoshoneSierra LeoneanSiouxSlavicSlovakSloveneSomaliSouth AfricanSouth AmericanSouth American IndianSoviet UnionSpaniardSpanishSpanish AmericanSpanish American IndianSri LankanSubsaharan AfricanSudaneseSwedishSwissSyrianTaiwaneseThaiTlingit-HaidaTohono O'OdhamTonganTrinidadian and TobagonianTsimshianTurkishU.S. Virgin IslanderUgandanUkrainianUruguayanUteVenezuelanVietnameseWelshWest IndianYakamaYaquiYugoslavianYumanYup'ikZimbabwean
Immigration
NonimmigrantsImmigrantsAfghanistanAfricaAlbaniaArgentinaArmeniaAsiaAustraliaAustriaBahamasBangladeshBarbadosBelarusBelgiumBelizeBoliviaBosnia and HerzegovinaBrazilBulgariaBurma/MyanmarCabo VerdeCambodiaCameroonCanadaCaribbeanCentral AmericaChileChinaColombiaCongoCosta RicaCroatiaCubaCzechoslovakiaDenmarkDominicaDominican RepublicEastern AfricaEastern AsiaEastern EuropeEcuadorEgyptEl SalvadorEnglandEritreaEuropeFijiFranceGermanyGhanaGreeceGrenadaGuatemalaGuyanaHaitiHondurasHong KongHungaryIndiaIndonesiaIranIraqIrelandIsraelItalyJamaicaJapanJordanKazakhstanKenyaKoreaKuwaitLaosLatin AmericaLatviaLebanonLiberiaLithuaniaMalaysiaMexicoMicronesiaMiddle AfricaMoldovaMoroccoNepalNetherlandsNicaraguaNigeriaNorth AmericaNorth MacedoniaNorthern AfricaNorthern EuropeNorwayOceaniaPakistanPanamaPeruPhilippinesPolandPortugalRomaniaRussiaSaudi ArabiaScotlandSenegalSerbiaSierra LeoneSingaporeSomaliaSouth AfricaSouth AmericaSouth Central AsiaSouth Eastern AsiaSouthern EuropeSpainSri LankaSt. Vincent and the GrenadinesSudanSwedenSwitzerlandSyriaTaiwanThailandTrinidad and TobagoTurkeyUgandaUkraineUruguayUzbekistanVenezuelaVietnamWest IndiesWestern AfricaWestern AsiaWestern EuropeYemenZaireZimbabweAzores
4 or more Vehicles in Household
Income
Poverty
Unemployment
Labor Participation
Family Structure
Vehicle Availability
Education Level
Disability

Immigrants from Ethiopia 4 or more Vehicles in Household
Tragic

5.7%
4+ VEHICLES AVAILABLE
2.4/ 100
METRIC RATING
247th/ 347
METRIC RANK

Immigrants from Ethiopia 4 or more Vehicles in Household Correlation Chart

The statistical analysis conducted on geographies consisting of 210,800,078 people shows a significant positive correlation between the proportion of Immigrants from Ethiopia and percentage of households with 4 or more vehicles available in the United States with a correlation coefficient (R) of 0.603 and weighted average of 5.7%. On average, for every 1% (one percent) increase in Immigrants from Ethiopia within a typical geography, there is an increase of 0.38% in percentage of households with 4 or more vehicles available.
Immigrants from Ethiopia 4 or more Vehicles in Household
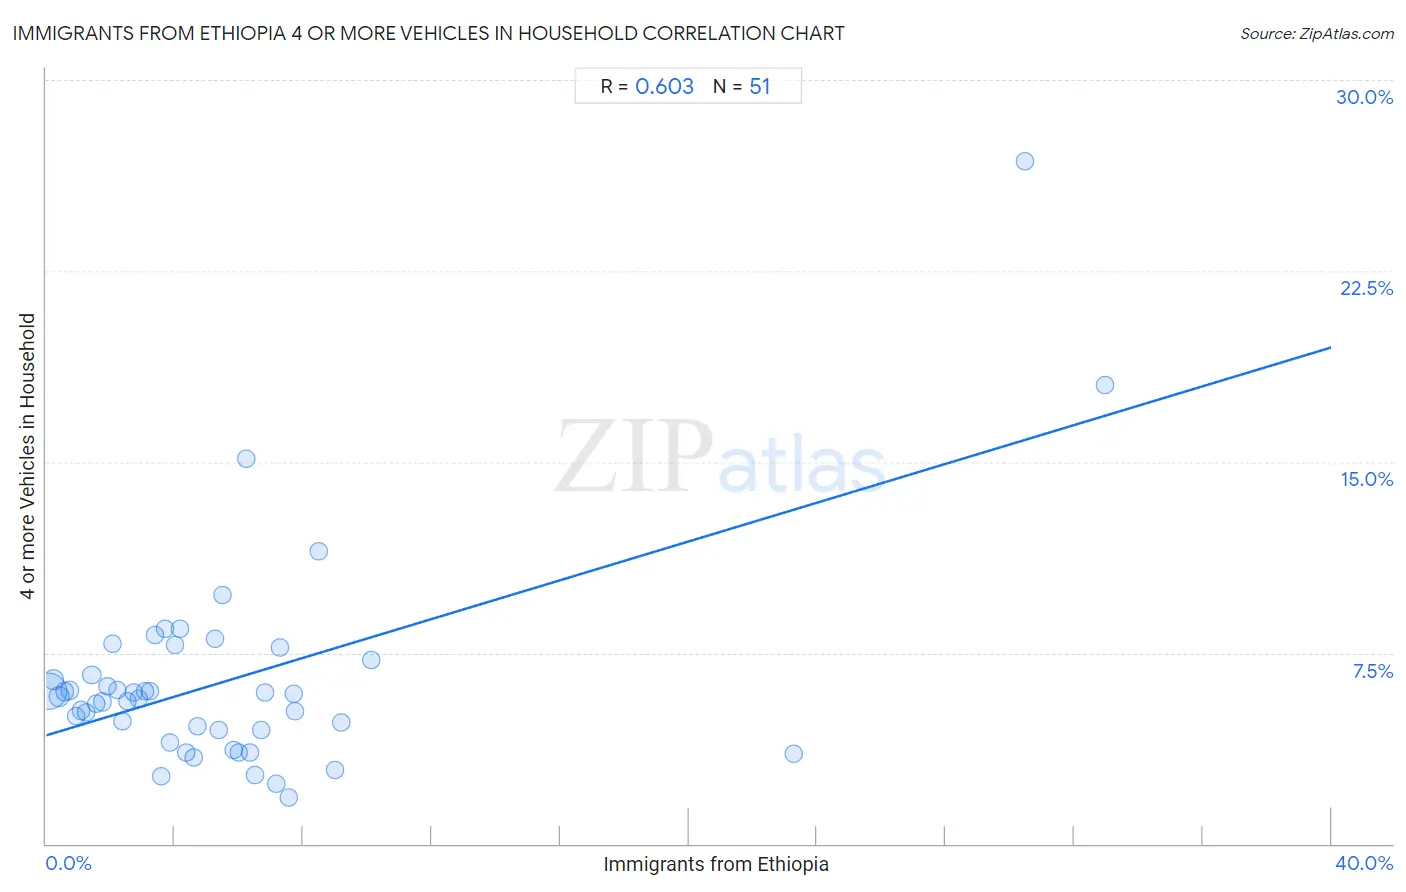
It is essential to understand that the correlation between the percentage of Immigrants from Ethiopia and percentage of households with 4 or more vehicles available does not imply a direct cause-and-effect relationship. It remains uncertain whether the presence of Immigrants from Ethiopia influences an upward or downward trend in the level of percentage of households with 4 or more vehicles available within an area, or if Immigrants from Ethiopia simply ended up residing in those areas with higher or lower levels of percentage of households with 4 or more vehicles available due to other factors.

Demographics Similar to Immigrants from Ethiopia by 4 or more Vehicles in Household

In terms of 4 or more vehicles in household, the demographic groups most similar to Immigrants from Ethiopia are Immigrants from North Macedonia (5.7%, a difference of 0.030%), Immigrants from Eastern Africa (5.7%, a difference of 0.11%), Immigrants from Southern Europe (5.7%, a difference of 0.13%), Immigrants from Europe (5.7%, a difference of 0.23%), and Ugandan (5.7%, a difference of 0.25%).
DemographicsRating | Rank4 or more Vehicles in Household
Immigrants from Poland
3.8
/100
|
#240
Tragic
5.8%
Mongolians
3.7
/100
|
#241
Tragic
5.8%
Immigrants from Middle Africa
3.4
/100
|
#242
Tragic
5.8%
Immigrants from Czechoslovakia
3.2
/100
|
#243
Tragic
5.8%
Ethiopians
3.2
/100
|
#244
Tragic
5.8%
Bulgarians
3.1
/100
|
#245
Tragic
5.8%
Immigrants from North Macedonia
2.5
/100
|
#246
Tragic
5.7%
Immigrants from Ethiopia
2.4
/100
|
#247
Tragic
5.7%
Immigrants from Eastern Africa
2.4
/100
|
#248
Tragic
5.7%
Immigrants from Southern Europe
2.3
/100
|
#249
Tragic
5.7%
Immigrants from Europe
2.3
/100
|
#250
Tragic
5.7%
Ugandans
2.2
/100
|
#251
Tragic
5.7%
Sub-Saharan Africans
2.1
/100
|
#252
Tragic
5.7%
Immigrants from Cuba
1.6
/100
|
#253
Tragic
5.7%
Immigrants from Panama
1.5
/100
|
#254
Tragic
5.7%

Immigrants from Ethiopia 4 or more Vehicles in Household Correlation Summary

MeasurementImmigrants from Ethiopia Data4 or more Vehicles in Household Data
Minimum0.061%1.8%
Maximum33.0%26.8%
Range32.9%24.9%
Mean5.7%6.4%
Median4.2%5.8%
Interquartile 25% (IQ1)2.1%4.5%
Interquartile 75% (IQ3)6.8%7.2%
Interquartile Range (IQR)4.8%2.7%
Standard Deviation (Sample)6.5%4.1%
Standard Deviation (Population)6.4%4.1%

Correlation Details

Immigrants from Ethiopia PercentileSample Size4 or more Vehicles in Household
[
0.0%
-
0.5%
]
0.061%
150,404,5626.0%
[
0.0%
-
0.5%
]
0.23%
24,989,9486.4%
[
0.0%
-
0.5%
]
0.41%
13,336,1965.8%
[
0.5%
-
1.0%
]
0.57%
4,621,1816.0%
[
0.5%
-
1.0%
]
0.73%
3,412,4176.0%
[
0.5%
-
1.0%
]
0.92%
2,593,4435.0%
[
1.0%
-
1.5%
]
1.08%
2,697,4215.2%
[
1.0%
-
1.5%
]
1.23%
1,600,7155.2%
[
1.0%
-
1.5%
]
1.42%
1,246,9306.6%
[
1.5%
-
2.0%
]
1.56%
973,8945.5%
[
1.5%
-
2.0%
]
1.73%
717,1595.6%
[
1.5%
-
2.0%
]
1.91%
440,3026.2%
[
2.0%
-
2.5%
]
2.07%
336,7587.8%
[
2.0%
-
2.5%
]
2.23%
195,5606.1%
[
2.0%
-
2.5%
]
2.38%
224,2764.8%
[
2.5%
-
3.0%
]
2.55%
255,7665.6%
[
2.5%
-
3.0%
]
2.72%
405,7405.9%
[
2.5%
-
3.0%
]
2.88%
295,4005.7%
[
3.0%
-
3.5%
]
3.06%
219,6326.0%
[
3.0%
-
3.5%
]
3.23%
166,4396.0%
[
3.0%
-
3.5%
]
3.40%
110,2298.2%
[
3.5%
-
4.0%
]
3.59%
62,7232.6%
[
3.5%
-
4.0%
]
3.71%
158,8248.5%
[
3.5%
-
4.0%
]
3.86%
263,0764.0%
[
3.5%
-
4.0%
]
4.00%
86,0297.8%
[
4.0%
-
4.5%
]
4.16%
33,8478.4%
[
4.0%
-
4.5%
]
4.37%
4,1613.6%
[
4.5%
-
5.0%
]
4.60%
73,0743.4%
[
4.5%
-
5.0%
]
4.70%
75,8064.6%
[
5.0%
-
5.5%
]
5.26%
25,3248.0%
[
5.0%
-
5.5%
]
5.37%
29,1324.5%
[
5.0%
-
5.5%
]
5.48%
11,2099.7%
[
5.5%
-
6.0%
]
5.85%
97,6613.7%
[
5.5%
-
6.0%
]
5.99%
152,9843.6%
[
6.0%
-
6.5%
]
6.24%
4,42515.1%
[
6.0%
-
6.5%
]
6.35%
56,7373.6%
[
6.5%
-
7.0%
]
6.51%
81,8082.7%
[
6.5%
-
7.0%
]
6.69%
73,2924.5%
[
6.5%
-
7.0%
]
6.82%
23,5055.9%
[
7.0%
-
7.5%
]
7.14%
75,5342.3%
[
7.0%
-
7.5%
]
7.28%
30,9277.7%
[
7.5%
-
8.0%
]
7.54%
17,5421.8%
[
7.5%
-
8.0%
]
7.71%
27,5235.9%
[
7.5%
-
8.0%
]
7.75%
37,2075.2%
[
8.0%
-
8.5%
]
8.50%
18,32411.5%
[
8.5%
-
9.0%
]
8.97%
5352.9%
[
9.0%
-
9.5%
]
9.17%
15,4894.8%
[
10.0%
-
10.5%
]
10.11%
14,5537.2%
[
23.0%
-
23.5%
]
23.25%
4,5723.6%
[
30.0%
-
30.5%
]
30.48%
10526.8%
[
32.5%
-
33.0%
]
32.97%
18218.0%