Immigrants from Costa Rica Wage/Income Gap

COMPARE

Immigrants from Costa Rica
Race
Ancestry
AfghanAfricanAlaska NativeAlaskan AthabascanAlbanianAleutAlsatianAmericanApacheArabArapahoArgentineanArmenianAssyrian/Chaldean/SyriacAustralianAustrianBahamianBangladeshiBarbadianBasqueBelgianBelizeanBermudanBhutaneseBlackfeetBolivianBrazilianBritishBritish West IndianBulgarianBurmeseCajunCambodianCanadianCape VerdeanCarpatho RusynCelticCentral AmericanCentral American IndianCherokeeCheyenneChickasawChileanChineseChippewaChoctawColombianColvilleComancheCosta RicanCreeCreekCroatianCrowCubanCypriotCzechCzechoslovakianDanishDelawareDominicanDutchDutch West IndianEastern EuropeanEcuadorianEgyptianEnglishEstonianEthiopianEuropeanFijianFilipinoFinnishFrenchFrench American IndianFrench CanadianGermanGerman RussianGhanaianGreekGuamanian/ChamorroGuatemalanGuyaneseHaitianHmongHonduranHopiHoumaHungarianIcelanderIndian (Asian)IndonesianInupiatIranianIraqiIrishIroquoisIsraeliItalianJamaicanJapaneseJordanianKenyanKiowaKoreanLaotianLatvianLebaneseLiberianLithuanianLumbeeLuxembourgerMacedonianMalaysianMalteseMarshalleseMenomineeMexicanMexican American IndianMongolianMoroccanNative HawaiianNavajoNepaleseNew ZealanderNicaraguanNigerianNorthern EuropeanNorwegianOkinawanOsageOttawaPaiutePakistaniPalestinianPanamanianParaguayanPennsylvania GermanPeruvianPimaPolishPortuguesePotawatomiPuebloPuerto RicanPuget Sound SalishRomanianRussianSalvadoranSamoanScandinavianScotch-IrishScottishSeminoleSenegaleseSerbianShoshoneSierra LeoneanSiouxSlavicSlovakSloveneSomaliSouth AfricanSouth AmericanSouth American IndianSoviet UnionSpaniardSpanishSpanish AmericanSpanish American IndianSri LankanSubsaharan AfricanSudaneseSwedishSwissSyrianTaiwaneseThaiTlingit-HaidaTohono O'OdhamTonganTrinidadian and TobagonianTsimshianTurkishU.S. Virgin IslanderUgandanUkrainianUruguayanUteVenezuelanVietnameseWelshWest IndianYakamaYaquiYugoslavianYumanYup'ikZimbabwean
Immigration
NonimmigrantsImmigrantsAfghanistanAfricaAlbaniaArgentinaArmeniaAsiaAustraliaAustriaBahamasBangladeshBarbadosBelarusBelgiumBelizeBoliviaBosnia and HerzegovinaBrazilBulgariaBurma/MyanmarCabo VerdeCambodiaCameroonCanadaCaribbeanCentral AmericaChileChinaColombiaCongoCosta RicaCroatiaCubaCzechoslovakiaDenmarkDominicaDominican RepublicEastern AfricaEastern AsiaEastern EuropeEcuadorEgyptEl SalvadorEnglandEritreaEthiopiaEuropeFijiFranceGermanyGhanaGreeceGrenadaGuatemalaGuyanaHaitiHondurasHong KongHungaryIndiaIndonesiaIranIraqIrelandIsraelItalyJamaicaJapanJordanKazakhstanKenyaKoreaKuwaitLaosLatin AmericaLatviaLebanonLiberiaLithuaniaMalaysiaMexicoMicronesiaMiddle AfricaMoldovaMoroccoNepalNetherlandsNicaraguaNigeriaNorth AmericaNorth MacedoniaNorthern AfricaNorthern EuropeNorwayOceaniaPakistanPanamaPeruPhilippinesPolandPortugalRomaniaRussiaSaudi ArabiaScotlandSenegalSerbiaSierra LeoneSingaporeSomaliaSouth AfricaSouth AmericaSouth Central AsiaSouth Eastern AsiaSouthern EuropeSpainSri LankaSt. Vincent and the GrenadinesSudanSwedenSwitzerlandSyriaTaiwanThailandTrinidad and TobagoTurkeyUgandaUkraineUruguayUzbekistanVenezuelaVietnamWest IndiesWestern AfricaWestern AsiaWestern EuropeYemenZaireZimbabweAzores
Select to Compare
Race
Ancestry
AfghanAfricanAlaska NativeAlaskan AthabascanAlbanianAleutAlsatianAmericanApacheArabArapahoArgentineanArmenianAssyrian/Chaldean/SyriacAustralianAustrianBahamianBangladeshiBarbadianBasqueBelgianBelizeanBermudanBhutaneseBlackfeetBolivianBrazilianBritishBritish West IndianBulgarianBurmeseCajunCambodianCanadianCape VerdeanCarpatho RusynCelticCentral AmericanCentral American IndianCherokeeCheyenneChickasawChileanChineseChippewaChoctawColombianColvilleComancheCosta RicanCreeCreekCroatianCrowCubanCypriotCzechCzechoslovakianDanishDelawareDominicanDutchDutch West IndianEastern EuropeanEcuadorianEgyptianEnglishEstonianEthiopianEuropeanFijianFilipinoFinnishFrenchFrench American IndianFrench CanadianGermanGerman RussianGhanaianGreekGuamanian/ChamorroGuatemalanGuyaneseHaitianHmongHonduranHopiHoumaHungarianIcelanderIndian (Asian)IndonesianInupiatIranianIraqiIrishIroquoisIsraeliItalianJamaicanJapaneseJordanianKenyanKiowaKoreanLaotianLatvianLebaneseLiberianLithuanianLumbeeLuxembourgerMacedonianMalaysianMalteseMarshalleseMenomineeMexicanMexican American IndianMongolianMoroccanNative HawaiianNavajoNepaleseNew ZealanderNicaraguanNigerianNorthern EuropeanNorwegianOkinawanOsageOttawaPaiutePakistaniPalestinianPanamanianParaguayanPennsylvania GermanPeruvianPimaPolishPortuguesePotawatomiPuebloPuerto RicanPuget Sound SalishRomanianRussianSalvadoranSamoanScandinavianScotch-IrishScottishSeminoleSenegaleseSerbianShoshoneSierra LeoneanSiouxSlavicSlovakSloveneSomaliSouth AfricanSouth AmericanSouth American IndianSoviet UnionSpaniardSpanishSpanish AmericanSpanish American IndianSri LankanSubsaharan AfricanSudaneseSwedishSwissSyrianTaiwaneseThaiTlingit-HaidaTohono O'OdhamTonganTrinidadian and TobagonianTsimshianTurkishU.S. Virgin IslanderUgandanUkrainianUruguayanUteVenezuelanVietnameseWelshWest IndianYakamaYaquiYugoslavianYumanYup'ikZimbabwean
Immigration
NonimmigrantsImmigrantsAfghanistanAfricaAlbaniaArgentinaArmeniaAsiaAustraliaAustriaBahamasBangladeshBarbadosBelarusBelgiumBelizeBoliviaBosnia and HerzegovinaBrazilBulgariaBurma/MyanmarCabo VerdeCambodiaCameroonCanadaCaribbeanCentral AmericaChileChinaColombiaCongoCroatiaCubaCzechoslovakiaDenmarkDominicaDominican RepublicEastern AfricaEastern AsiaEastern EuropeEcuadorEgyptEl SalvadorEnglandEritreaEthiopiaEuropeFijiFranceGermanyGhanaGreeceGrenadaGuatemalaGuyanaHaitiHondurasHong KongHungaryIndiaIndonesiaIranIraqIrelandIsraelItalyJamaicaJapanJordanKazakhstanKenyaKoreaKuwaitLaosLatin AmericaLatviaLebanonLiberiaLithuaniaMalaysiaMexicoMicronesiaMiddle AfricaMoldovaMoroccoNepalNetherlandsNicaraguaNigeriaNorth AmericaNorth MacedoniaNorthern AfricaNorthern EuropeNorwayOceaniaPakistanPanamaPeruPhilippinesPolandPortugalRomaniaRussiaSaudi ArabiaScotlandSenegalSerbiaSierra LeoneSingaporeSomaliaSouth AfricaSouth AmericaSouth Central AsiaSouth Eastern AsiaSouthern EuropeSpainSri LankaSt. Vincent and the GrenadinesSudanSwedenSwitzerlandSyriaTaiwanThailandTrinidad and TobagoTurkeyUgandaUkraineUruguayUzbekistanVenezuelaVietnamWest IndiesWestern AfricaWestern AsiaWestern EuropeYemenZaireZimbabweAzores
Wage/Income Gap
Income
Poverty
Unemployment
Labor Participation
Family Structure
Vehicle Availability
Education Level
Disability

Immigrants from Costa Rica Wage/Income Gap
Exceptional

24.7%
WAGE/INCOME GAP
92.4/ 100
METRIC RATING
132nd/ 347
METRIC RANK

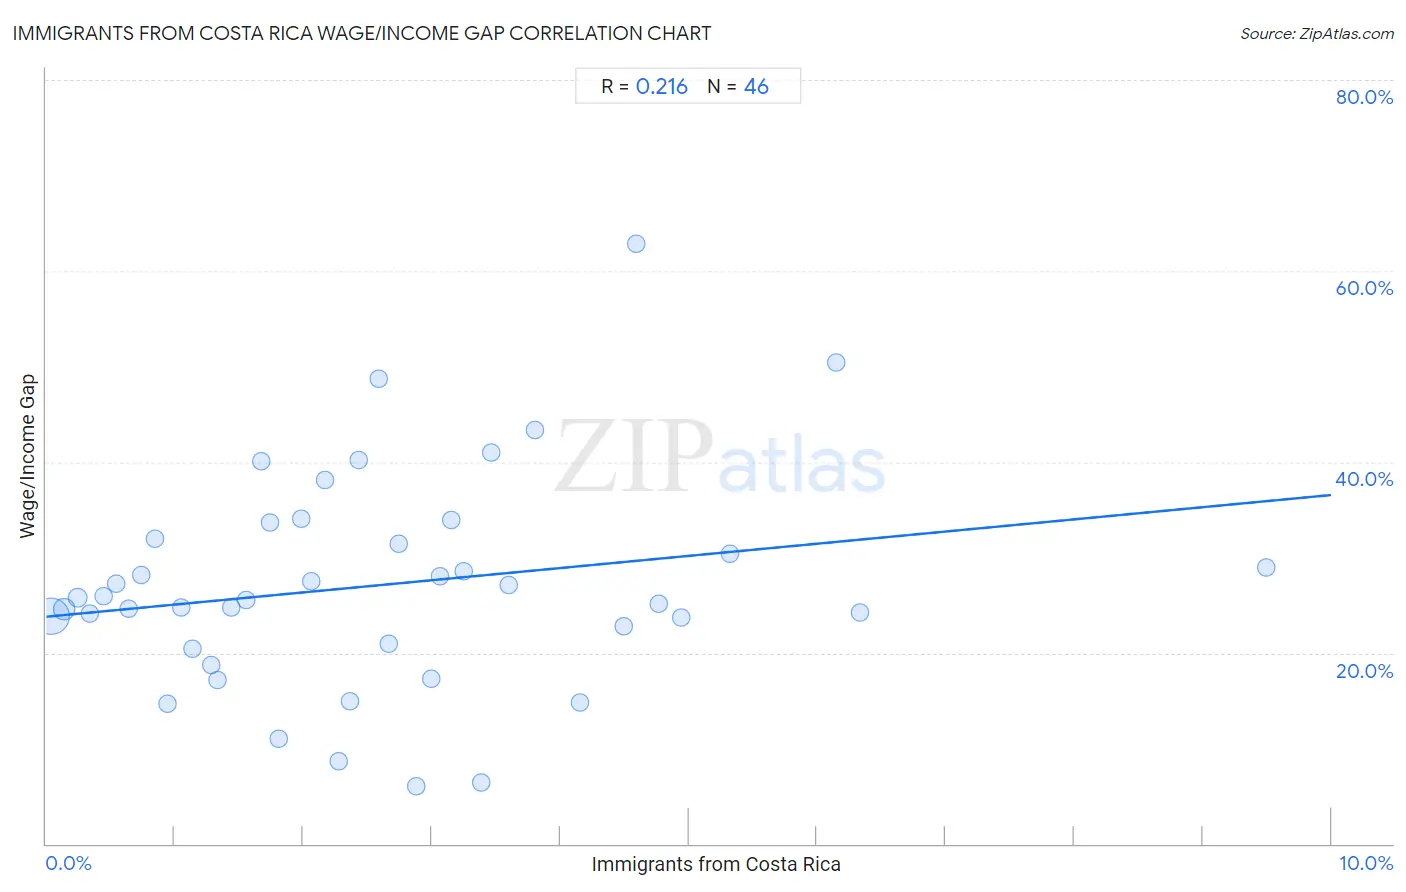
Immigrants from Costa Rica Wage/Income Gap Correlation Chart

The statistical analysis conducted on geographies consisting of 204,249,017 people shows a weak positive correlation between the proportion of Immigrants from Costa Rica and wage/income gap percentage in the United States with a correlation coefficient (R) of 0.216 and weighted average of 24.7%. On average, for every 1% (one percent) increase in Immigrants from Costa Rica within a typical geography, there is an increase of 1.3% in wage/income gap percentage.
Immigrants from Costa Rica Wage/Income Gap
It is essential to understand that the correlation between the percentage of Immigrants from Costa Rica and wage/income gap percentage does not imply a direct cause-and-effect relationship. It remains uncertain whether the presence of Immigrants from Costa Rica influences an upward or downward trend in the level of wage/income gap percentage within an area, or if Immigrants from Costa Rica simply ended up residing in those areas with higher or lower levels of wage/income gap percentage due to other factors.

Demographics Similar to Immigrants from Costa Rica by Wage/Income Gap

In terms of wage/income gap, the demographic groups most similar to Immigrants from Costa Rica are Colombian (24.7%, a difference of 0.0%), Mexican American Indian (24.7%, a difference of 0.040%), South American Indian (24.7%, a difference of 0.10%), Immigrants from Philippines (24.7%, a difference of 0.15%), and Alsatian (24.7%, a difference of 0.22%).
DemographicsRating | RankWage/Income Gap
Spanish Americans
93.8
/100
|
#125
Exceptional
24.6%
Immigrants from Uruguay
93.8
/100
|
#126
Exceptional
24.6%
German Russians
93.7
/100
|
#127
Exceptional
24.6%
Immigrants from Central America
93.5
/100
|
#128
Exceptional
24.6%
Yup'ik
93.3
/100
|
#129
Exceptional
24.7%
Alsatians
93.2
/100
|
#130
Exceptional
24.7%
Immigrants from Philippines
93.0
/100
|
#131
Exceptional
24.7%
Immigrants from Costa Rica
92.4
/100
|
#132
Exceptional
24.7%
Colombians
92.4
/100
|
#133
Exceptional
24.7%
Mexican American Indians
92.2
/100
|
#134
Exceptional
24.7%
South American Indians
92.0
/100
|
#135
Exceptional
24.7%
Armenians
91.3
/100
|
#136
Exceptional
24.8%
Immigrants from South Eastern Asia
90.9
/100
|
#137
Exceptional
24.8%
Immigrants from Bosnia and Herzegovina
90.1
/100
|
#138
Exceptional
24.8%
Hispanics or Latinos
89.5
/100
|
#139
Excellent
24.9%

Immigrants from Costa Rica Wage/Income Gap Correlation Summary

MeasurementImmigrants from Costa Rica DataWage/Income Gap Data
Minimum0.037%6.0%
Maximum9.5%62.8%
Range9.5%56.8%
Mean2.6%27.1%
Median2.3%25.7%
Interquartile 25% (IQ1)1.1%20.9%
Interquartile 75% (IQ3)3.5%31.9%
Interquartile Range (IQR)2.3%11.0%
Standard Deviation (Sample)1.9%11.3%
Standard Deviation (Population)1.9%11.2%

Correlation Details

Immigrants from Costa Rica PercentileSample SizeWage/Income Gap
[
0.0%
-
0.5%
]
0.037%
161,393,93123.8%
[
0.0%
-
0.5%
]
0.14%
25,342,32324.6%
[
0.0%
-
0.5%
]
0.25%
8,017,03925.8%
[
0.0%
-
0.5%
]
0.34%
3,469,92024.1%
[
0.0%
-
0.5%
]
0.44%
1,717,57725.9%
[
0.5%
-
1.0%
]
0.54%
1,206,71227.2%
[
0.5%
-
1.0%
]
0.64%
989,14724.7%
[
0.5%
-
1.0%
]
0.74%
404,99328.1%
[
0.5%
-
1.0%
]
0.84%
381,48131.9%
[
0.5%
-
1.0%
]
0.95%
236,55714.6%
[
1.0%
-
1.5%
]
1.05%
230,50624.7%
[
1.0%
-
1.5%
]
1.14%
121,03120.4%
[
1.0%
-
1.5%
]
1.28%
218,78418.7%
[
1.0%
-
1.5%
]
1.33%
59,68117.1%
[
1.0%
-
1.5%
]
1.44%
51,07224.8%
[
1.5%
-
2.0%
]
1.56%
5,32425.5%
[
1.5%
-
2.0%
]
1.67%
72,62840.1%
[
1.5%
-
2.0%
]
1.74%
4,58933.7%
[
1.5%
-
2.0%
]
1.81%
28,52111.0%
[
1.5%
-
2.0%
]
1.98%
52,93834.0%
[
2.0%
-
2.5%
]
2.06%
7,57227.5%
[
2.0%
-
2.5%
]
2.17%
26,62438.1%
[
2.0%
-
2.5%
]
2.27%
11,1668.6%
[
2.0%
-
2.5%
]
2.36%
13,41714.9%
[
2.0%
-
2.5%
]
2.43%
32940.2%
[
2.5%
-
3.0%
]
2.59%
24,74848.7%
[
2.5%
-
3.0%
]
2.67%
2,66120.9%
[
2.5%
-
3.0%
]
2.74%
45,94931.4%
[
2.5%
-
3.0%
]
2.88%
33,5416.0%
[
2.5%
-
3.0%
]
3.00%
3,13817.3%
[
3.0%
-
3.5%
]
3.06%
9828.0%
[
3.0%
-
3.5%
]
3.15%
4,79133.8%
[
3.0%
-
3.5%
]
3.25%
18,89028.5%
[
3.0%
-
3.5%
]
3.39%
5,2266.4%
[
3.0%
-
3.5%
]
3.47%
1,76041.0%
[
3.5%
-
4.0%
]
3.60%
27827.1%
[
3.5%
-
4.0%
]
3.81%
65743.3%
[
4.0%
-
4.5%
]
4.16%
1,53914.8%
[
4.0%
-
4.5%
]
4.50%
2,71422.8%
[
4.5%
-
5.0%
]
4.59%
50162.8%
[
4.5%
-
5.0%
]
4.77%
8,28725.1%
[
4.5%
-
5.0%
]
4.94%
1,51923.7%
[
5.0%
-
5.5%
]
5.32%
14,78930.3%
[
6.0%
-
6.5%
]
6.15%
1,59450.4%
[
6.0%
-
6.5%
]
6.33%
11,90624.2%
[
9.0%
-
9.5%
]
9.49%
56928.9%