Immigrants from Costa Rica 4 or more Vehicles in Household
COMPARE
Immigrants from Costa Rica
Select to Compare
4 or more Vehicles in Household
Immigrants from Costa Rica 4 or more Vehicles in Household
6.5%
4+ VEHICLES AVAILABLE
74.4/ 100
METRIC RATING
146th/ 347
METRIC RANK
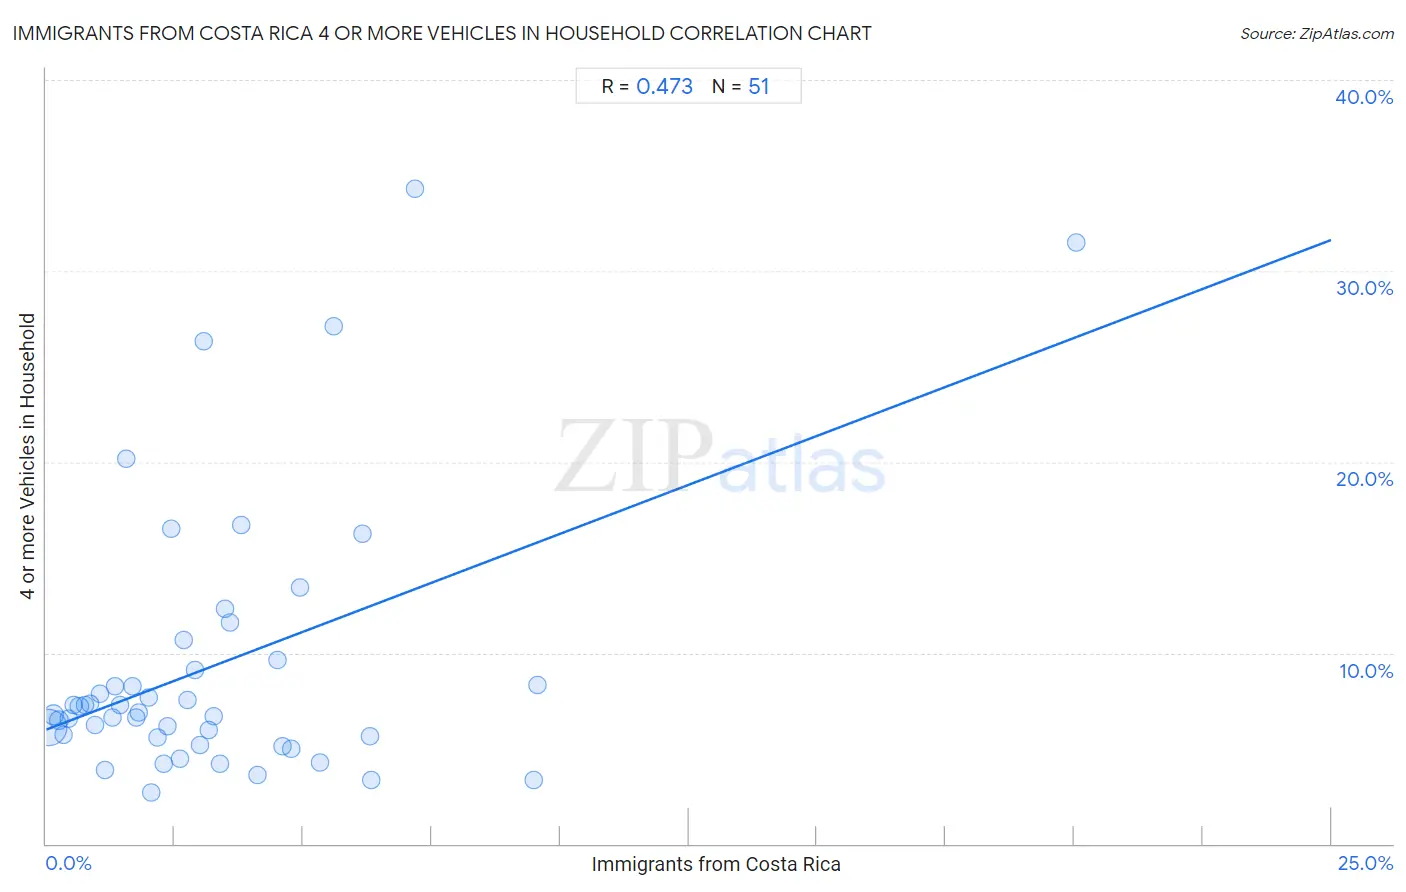
Immigrants from Costa Rica 4 or more Vehicles in Household Correlation Chart
The statistical analysis conducted on geographies consisting of 203,475,365 people shows a moderate positive correlation between the proportion of Immigrants from Costa Rica and percentage of households with 4 or more vehicles available in the United States with a correlation coefficient (R) of 0.473 and weighted average of 6.5%. On average, for every 1% (one percent) increase in Immigrants from Costa Rica within a typical geography, there is an increase of 1.0% in percentage of households with 4 or more vehicles available.
It is essential to understand that the correlation between the percentage of Immigrants from Costa Rica and percentage of households with 4 or more vehicles available does not imply a direct cause-and-effect relationship. It remains uncertain whether the presence of Immigrants from Costa Rica influences an upward or downward trend in the level of percentage of households with 4 or more vehicles available within an area, or if Immigrants from Costa Rica simply ended up residing in those areas with higher or lower levels of percentage of households with 4 or more vehicles available due to other factors.
Demographics Similar to Immigrants from Costa Rica by 4 or more Vehicles in Household
In terms of 4 or more vehicles in household, the demographic groups most similar to Immigrants from Costa Rica are Immigrants from Iran (6.5%, a difference of 0.050%), Immigrants from Jordan (6.5%, a difference of 0.090%), Greek (6.5%, a difference of 0.090%), New Zealander (6.5%, a difference of 0.13%), and Immigrants from Hong Kong (6.5%, a difference of 0.27%).
| Demographics | Rating | Rank | 4 or more Vehicles in Household |
| Jordanians | 82.1 /100 | #139 | Excellent 6.6% |
| Slavs | 81.6 /100 | #140 | Excellent 6.6% |
| Australians | 80.8 /100 | #141 | Excellent 6.6% |
| Immigrants from Iraq | 79.4 /100 | #142 | Good 6.5% |
| Immigrants from Canada | 78.6 /100 | #143 | Good 6.5% |
| Immigrants from North America | 78.5 /100 | #144 | Good 6.5% |
| Croatians | 77.8 /100 | #145 | Good 6.5% |
| Immigrants from Costa Rica | 74.4 /100 | #146 | Good 6.5% |
| Immigrants from Iran | 73.9 /100 | #147 | Good 6.5% |
| Immigrants from Jordan | 73.7 /100 | #148 | Good 6.5% |
| Greeks | 73.6 /100 | #149 | Good 6.5% |
| New Zealanders | 73.3 /100 | #150 | Good 6.5% |
| Immigrants from Hong Kong | 72.2 /100 | #151 | Good 6.5% |
| Yuman | 72.1 /100 | #152 | Good 6.5% |
| Immigrants from Armenia | 71.2 /100 | #153 | Good 6.5% |
Immigrants from Costa Rica 4 or more Vehicles in Household Correlation Summary
| Measurement | Immigrants from Costa Rica Data | 4 or more Vehicles in Household Data |
| Minimum | 0.037% | 2.7% |
| Maximum | 20.0% | 34.3% |
| Range | 20.0% | 31.6% |
| Mean | 3.3% | 9.4% |
| Median | 2.6% | 6.9% |
| Interquartile 25% (IQ1) | 1.3% | 5.6% |
| Interquartile 75% (IQ3) | 4.5% | 9.6% |
| Interquartile Range (IQR) | 3.2% | 4.1% |
| Standard Deviation (Sample) | 3.3% | 7.1% |
| Standard Deviation (Population) | 3.2% | 7.0% |
Correlation Details
| Immigrants from Costa Rica Percentile | Sample Size | 4 or more Vehicles in Household |
[ 0.0% - 0.5% ] 0.037% | 160,745,734 | 6.1% |
[ 0.0% - 0.5% ] 0.14% | 25,282,115 | 6.7% |
[ 0.0% - 0.5% ] 0.25% | 7,972,803 | 6.5% |
[ 0.0% - 0.5% ] 0.34% | 3,442,534 | 5.7% |
[ 0.0% - 0.5% ] 0.44% | 1,721,221 | 6.6% |
[ 0.5% - 1.0% ] 0.54% | 1,206,712 | 7.2% |
[ 0.5% - 1.0% ] 0.64% | 988,490 | 7.2% |
[ 0.5% - 1.0% ] 0.74% | 403,362 | 7.2% |
[ 0.5% - 1.0% ] 0.84% | 380,490 | 7.3% |
[ 0.5% - 1.0% ] 0.95% | 236,557 | 6.2% |
[ 1.0% - 1.5% ] 1.05% | 232,111 | 7.9% |
[ 1.0% - 1.5% ] 1.14% | 121,031 | 3.8% |
[ 1.0% - 1.5% ] 1.28% | 218,784 | 6.6% |
[ 1.0% - 1.5% ] 1.33% | 59,681 | 8.3% |
[ 1.0% - 1.5% ] 1.44% | 54,045 | 7.3% |
[ 1.5% - 2.0% ] 1.56% | 5,324 | 20.2% |
[ 1.5% - 2.0% ] 1.67% | 68,684 | 8.3% |
[ 1.5% - 2.0% ] 1.74% | 4,589 | 6.6% |
[ 1.5% - 2.0% ] 1.81% | 26,949 | 6.9% |
[ 1.5% - 2.0% ] 1.98% | 52,938 | 7.6% |
[ 2.0% - 2.5% ] 2.05% | 9,266 | 2.7% |
[ 2.0% - 2.5% ] 2.17% | 26,624 | 5.6% |
[ 2.0% - 2.5% ] 2.27% | 11,166 | 4.2% |
[ 2.0% - 2.5% ] 2.36% | 11,960 | 6.2% |
[ 2.0% - 2.5% ] 2.43% | 329 | 16.5% |
[ 2.5% - 3.0% ] 2.59% | 24,748 | 4.5% |
[ 2.5% - 3.0% ] 2.67% | 2,661 | 10.7% |
[ 2.5% - 3.0% ] 2.74% | 45,949 | 7.5% |
[ 2.5% - 3.0% ] 2.88% | 33,541 | 9.1% |
[ 2.5% - 3.0% ] 3.00% | 3,138 | 5.2% |
[ 3.0% - 3.5% ] 3.06% | 98 | 26.3% |
[ 3.0% - 3.5% ] 3.15% | 4,791 | 5.9% |
[ 3.0% - 3.5% ] 3.25% | 19,759 | 6.7% |
[ 3.0% - 3.5% ] 3.39% | 5,226 | 4.2% |
[ 3.0% - 3.5% ] 3.47% | 1,760 | 12.3% |
[ 3.5% - 4.0% ] 3.58% | 923 | 11.6% |
[ 3.5% - 4.0% ] 3.81% | 657 | 16.7% |
[ 4.0% - 4.5% ] 4.12% | 753 | 3.6% |
[ 4.0% - 4.5% ] 4.50% | 2,714 | 9.6% |
[ 4.5% - 5.0% ] 4.59% | 501 | 5.1% |
[ 4.5% - 5.0% ] 4.77% | 8,287 | 5.0% |
[ 4.5% - 5.0% ] 4.94% | 1,519 | 13.5% |
[ 5.0% - 5.5% ] 5.32% | 14,789 | 4.2% |
[ 5.5% - 6.0% ] 5.59% | 143 | 27.1% |
[ 6.0% - 6.5% ] 6.15% | 1,594 | 16.2% |
[ 6.0% - 6.5% ] 6.29% | 318 | 5.6% |
[ 6.0% - 6.5% ] 6.33% | 11,906 | 3.4% |
[ 7.0% - 7.5% ] 7.19% | 167 | 34.3% |
[ 9.0% - 9.5% ] 9.49% | 569 | 3.4% |
[ 9.5% - 10.0% ] 9.56% | 4,771 | 8.3% |
[ 20.0% - 20.5% ] 20.03% | 584 | 31.5% |