Immigrants from Costa Rica Self-Care Disability

COMPARE

Immigrants from Costa Rica
Race
Ancestry
AfghanAfricanAlaska NativeAlaskan AthabascanAlbanianAleutAlsatianAmericanApacheArabArapahoArgentineanArmenianAssyrian/Chaldean/SyriacAustralianAustrianBahamianBangladeshiBarbadianBasqueBelgianBelizeanBermudanBhutaneseBlackfeetBolivianBrazilianBritishBritish West IndianBulgarianBurmeseCajunCambodianCanadianCape VerdeanCarpatho RusynCelticCentral AmericanCentral American IndianCherokeeCheyenneChickasawChileanChineseChippewaChoctawColombianColvilleComancheCosta RicanCreeCreekCroatianCrowCubanCypriotCzechCzechoslovakianDanishDelawareDominicanDutchDutch West IndianEastern EuropeanEcuadorianEgyptianEnglishEstonianEthiopianEuropeanFijianFilipinoFinnishFrenchFrench American IndianFrench CanadianGermanGerman RussianGhanaianGreekGuamanian/ChamorroGuatemalanGuyaneseHaitianHmongHonduranHopiHoumaHungarianIcelanderIndian (Asian)IndonesianInupiatIranianIraqiIrishIroquoisIsraeliItalianJamaicanJapaneseJordanianKenyanKiowaKoreanLaotianLatvianLebaneseLiberianLithuanianLumbeeLuxembourgerMacedonianMalaysianMalteseMarshalleseMenomineeMexicanMexican American IndianMongolianMoroccanNative HawaiianNavajoNepaleseNew ZealanderNicaraguanNigerianNorthern EuropeanNorwegianOkinawanOsageOttawaPaiutePakistaniPalestinianPanamanianParaguayanPennsylvania GermanPeruvianPimaPolishPortuguesePotawatomiPuebloPuerto RicanPuget Sound SalishRomanianRussianSalvadoranSamoanScandinavianScotch-IrishScottishSeminoleSenegaleseSerbianShoshoneSierra LeoneanSiouxSlavicSlovakSloveneSomaliSouth AfricanSouth AmericanSouth American IndianSoviet UnionSpaniardSpanishSpanish AmericanSpanish American IndianSri LankanSubsaharan AfricanSudaneseSwedishSwissSyrianTaiwaneseThaiTlingit-HaidaTohono O'OdhamTonganTrinidadian and TobagonianTsimshianTurkishU.S. Virgin IslanderUgandanUkrainianUruguayanUteVenezuelanVietnameseWelshWest IndianYakamaYaquiYugoslavianYumanYup'ikZimbabwean
Immigration
NonimmigrantsImmigrantsAfghanistanAfricaAlbaniaArgentinaArmeniaAsiaAustraliaAustriaBahamasBangladeshBarbadosBelarusBelgiumBelizeBoliviaBosnia and HerzegovinaBrazilBulgariaBurma/MyanmarCabo VerdeCambodiaCameroonCanadaCaribbeanCentral AmericaChileChinaColombiaCongoCosta RicaCroatiaCubaCzechoslovakiaDenmarkDominicaDominican RepublicEastern AfricaEastern AsiaEastern EuropeEcuadorEgyptEl SalvadorEnglandEritreaEthiopiaEuropeFijiFranceGermanyGhanaGreeceGrenadaGuatemalaGuyanaHaitiHondurasHong KongHungaryIndiaIndonesiaIranIraqIrelandIsraelItalyJamaicaJapanJordanKazakhstanKenyaKoreaKuwaitLaosLatin AmericaLatviaLebanonLiberiaLithuaniaMalaysiaMexicoMicronesiaMiddle AfricaMoldovaMoroccoNepalNetherlandsNicaraguaNigeriaNorth AmericaNorth MacedoniaNorthern AfricaNorthern EuropeNorwayOceaniaPakistanPanamaPeruPhilippinesPolandPortugalRomaniaRussiaSaudi ArabiaScotlandSenegalSerbiaSierra LeoneSingaporeSomaliaSouth AfricaSouth AmericaSouth Central AsiaSouth Eastern AsiaSouthern EuropeSpainSri LankaSt. Vincent and the GrenadinesSudanSwedenSwitzerlandSyriaTaiwanThailandTrinidad and TobagoTurkeyUgandaUkraineUruguayUzbekistanVenezuelaVietnamWest IndiesWestern AfricaWestern AsiaWestern EuropeYemenZaireZimbabweAzores
Select to Compare
Race
Ancestry
AfghanAfricanAlaska NativeAlaskan AthabascanAlbanianAleutAlsatianAmericanApacheArabArapahoArgentineanArmenianAssyrian/Chaldean/SyriacAustralianAustrianBahamianBangladeshiBarbadianBasqueBelgianBelizeanBermudanBhutaneseBlackfeetBolivianBrazilianBritishBritish West IndianBulgarianBurmeseCajunCambodianCanadianCape VerdeanCarpatho RusynCelticCentral AmericanCentral American IndianCherokeeCheyenneChickasawChileanChineseChippewaChoctawColombianColvilleComancheCosta RicanCreeCreekCroatianCrowCubanCypriotCzechCzechoslovakianDanishDelawareDominicanDutchDutch West IndianEastern EuropeanEcuadorianEgyptianEnglishEstonianEthiopianEuropeanFijianFilipinoFinnishFrenchFrench American IndianFrench CanadianGermanGerman RussianGhanaianGreekGuamanian/ChamorroGuatemalanGuyaneseHaitianHmongHonduranHopiHoumaHungarianIcelanderIndian (Asian)IndonesianInupiatIranianIraqiIrishIroquoisIsraeliItalianJamaicanJapaneseJordanianKenyanKiowaKoreanLaotianLatvianLebaneseLiberianLithuanianLumbeeLuxembourgerMacedonianMalaysianMalteseMarshalleseMenomineeMexicanMexican American IndianMongolianMoroccanNative HawaiianNavajoNepaleseNew ZealanderNicaraguanNigerianNorthern EuropeanNorwegianOkinawanOsageOttawaPaiutePakistaniPalestinianPanamanianParaguayanPennsylvania GermanPeruvianPimaPolishPortuguesePotawatomiPuebloPuerto RicanPuget Sound SalishRomanianRussianSalvadoranSamoanScandinavianScotch-IrishScottishSeminoleSenegaleseSerbianShoshoneSierra LeoneanSiouxSlavicSlovakSloveneSomaliSouth AfricanSouth AmericanSouth American IndianSoviet UnionSpaniardSpanishSpanish AmericanSpanish American IndianSri LankanSubsaharan AfricanSudaneseSwedishSwissSyrianTaiwaneseThaiTlingit-HaidaTohono O'OdhamTonganTrinidadian and TobagonianTsimshianTurkishU.S. Virgin IslanderUgandanUkrainianUruguayanUteVenezuelanVietnameseWelshWest IndianYakamaYaquiYugoslavianYumanYup'ikZimbabwean
Immigration
NonimmigrantsImmigrantsAfghanistanAfricaAlbaniaArgentinaArmeniaAsiaAustraliaAustriaBahamasBangladeshBarbadosBelarusBelgiumBelizeBoliviaBosnia and HerzegovinaBrazilBulgariaBurma/MyanmarCabo VerdeCambodiaCameroonCanadaCaribbeanCentral AmericaChileChinaColombiaCongoCroatiaCubaCzechoslovakiaDenmarkDominicaDominican RepublicEastern AfricaEastern AsiaEastern EuropeEcuadorEgyptEl SalvadorEnglandEritreaEthiopiaEuropeFijiFranceGermanyGhanaGreeceGrenadaGuatemalaGuyanaHaitiHondurasHong KongHungaryIndiaIndonesiaIranIraqIrelandIsraelItalyJamaicaJapanJordanKazakhstanKenyaKoreaKuwaitLaosLatin AmericaLatviaLebanonLiberiaLithuaniaMalaysiaMexicoMicronesiaMiddle AfricaMoldovaMoroccoNepalNetherlandsNicaraguaNigeriaNorth AmericaNorth MacedoniaNorthern AfricaNorthern EuropeNorwayOceaniaPakistanPanamaPeruPhilippinesPolandPortugalRomaniaRussiaSaudi ArabiaScotlandSenegalSerbiaSierra LeoneSingaporeSomaliaSouth AfricaSouth AmericaSouth Central AsiaSouth Eastern AsiaSouthern EuropeSpainSri LankaSt. Vincent and the GrenadinesSudanSwedenSwitzerlandSyriaTaiwanThailandTrinidad and TobagoTurkeyUgandaUkraineUruguayUzbekistanVenezuelaVietnamWest IndiesWestern AfricaWestern AsiaWestern EuropeYemenZaireZimbabweAzores
Self-Care Disability
Income
Poverty
Unemployment
Labor Participation
Family Structure
Vehicle Availability
Education Level
Disability

Immigrants from Costa Rica Self-Care Disability
Good

2.4%
SELF-CARE DISABILITY
75.1/ 100
METRIC RATING
150th/ 347
METRIC RANK

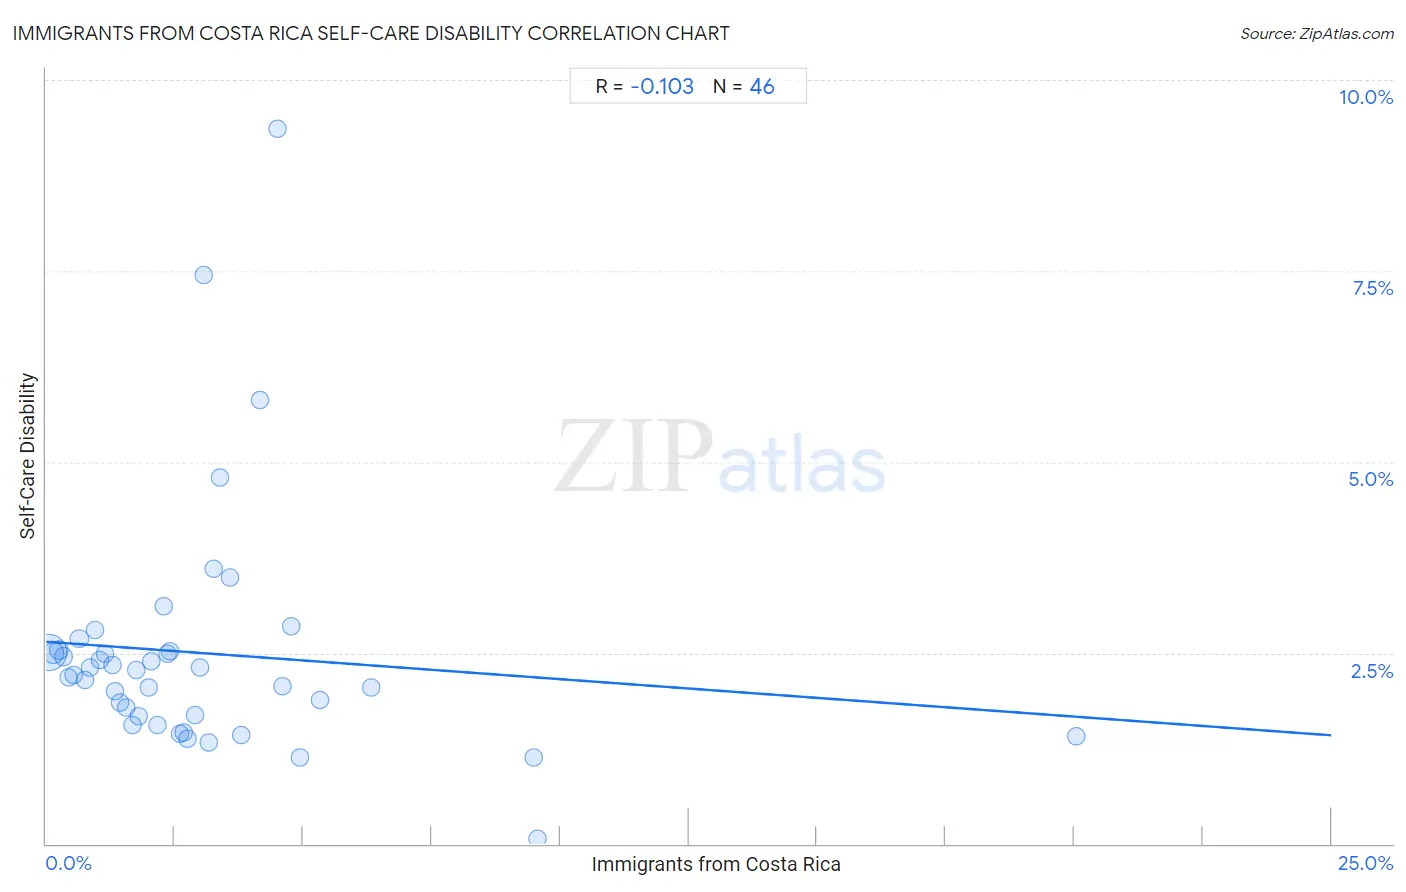
Immigrants from Costa Rica Self-Care Disability Correlation Chart

The statistical analysis conducted on geographies consisting of 204,207,185 people shows a poor negative correlation between the proportion of Immigrants from Costa Rica and percentage of population with self-care disability in the United States with a correlation coefficient (R) of -0.103 and weighted average of 2.4%. On average, for every 1% (one percent) increase in Immigrants from Costa Rica within a typical geography, there is a decrease of 0.049% in percentage of population with self-care disability.
Immigrants from Costa Rica Self-Care Disability
It is essential to understand that the correlation between the percentage of Immigrants from Costa Rica and percentage of population with self-care disability does not imply a direct cause-and-effect relationship. It remains uncertain whether the presence of Immigrants from Costa Rica influences an upward or downward trend in the level of percentage of population with self-care disability within an area, or if Immigrants from Costa Rica simply ended up residing in those areas with higher or lower levels of percentage of population with self-care disability due to other factors.

Demographics Similar to Immigrants from Costa Rica by Self-Care Disability

In terms of self-care disability, the demographic groups most similar to Immigrants from Costa Rica are Arab (2.4%, a difference of 0.040%), Romanian (2.4%, a difference of 0.050%), Basque (2.4%, a difference of 0.070%), Tlingit-Haida (2.4%, a difference of 0.10%), and Immigrants from England (2.4%, a difference of 0.10%).
DemographicsRating | RankSelf-Care Disability
Afghans
82.3
/100
|
#143
Excellent
2.4%
Costa Ricans
80.8
/100
|
#144
Excellent
2.4%
Germans
80.1
/100
|
#145
Excellent
2.4%
Israelis
80.0
/100
|
#146
Good
2.4%
Dutch
77.5
/100
|
#147
Good
2.4%
Romanians
75.8
/100
|
#148
Good
2.4%
Arabs
75.7
/100
|
#149
Good
2.4%
Immigrants from Costa Rica
75.1
/100
|
#150
Good
2.4%
Basques
74.0
/100
|
#151
Good
2.4%
Tlingit-Haida
73.5
/100
|
#152
Good
2.4%
Immigrants from England
73.5
/100
|
#153
Good
2.4%
Italians
72.2
/100
|
#154
Good
2.4%
Pakistanis
71.4
/100
|
#155
Good
2.4%
Nigerians
70.6
/100
|
#156
Good
2.4%
Immigrants from Europe
69.6
/100
|
#157
Good
2.4%

Immigrants from Costa Rica Self-Care Disability Correlation Summary

MeasurementImmigrants from Costa Rica DataSelf-Care Disability Data
Minimum0.037%0.069%
Maximum20.0%9.4%
Range20.0%9.3%
Mean3.0%2.5%
Median2.3%2.2%
Interquartile 25% (IQ1)1.1%1.7%
Interquartile 75% (IQ3)3.6%2.5%
Interquartile Range (IQR)2.4%0.85%
Standard Deviation (Sample)3.3%1.6%
Standard Deviation (Population)3.3%1.6%

Correlation Details

Immigrants from Costa Rica PercentileSample SizeSelf-Care Disability
[
0.0%
-
0.5%
]
0.037%
161,379,6282.5%
[
0.0%
-
0.5%
]
0.14%
25,343,9992.5%
[
0.0%
-
0.5%
]
0.25%
8,007,1342.5%
[
0.0%
-
0.5%
]
0.34%
3,450,9362.4%
[
0.0%
-
0.5%
]
0.44%
1,720,4502.2%
[
0.5%
-
1.0%
]
0.54%
1,196,9352.2%
[
0.5%
-
1.0%
]
0.64%
986,9192.7%
[
0.5%
-
1.0%
]
0.74%
405,7522.1%
[
0.5%
-
1.0%
]
0.84%
381,4812.3%
[
0.5%
-
1.0%
]
0.95%
236,5572.8%
[
1.0%
-
1.5%
]
1.05%
232,1112.4%
[
1.0%
-
1.5%
]
1.14%
121,8832.5%
[
1.0%
-
1.5%
]
1.28%
218,7842.3%
[
1.0%
-
1.5%
]
1.33%
59,6812.0%
[
1.0%
-
1.5%
]
1.44%
54,0451.9%
[
1.5%
-
2.0%
]
1.56%
5,3241.8%
[
1.5%
-
2.0%
]
1.67%
72,6281.6%
[
1.5%
-
2.0%
]
1.74%
4,5892.3%
[
1.5%
-
2.0%
]
1.81%
28,5211.7%
[
1.5%
-
2.0%
]
1.98%
52,6232.0%
[
2.0%
-
2.5%
]
2.05%
9,2662.4%
[
2.0%
-
2.5%
]
2.17%
26,6241.6%
[
2.0%
-
2.5%
]
2.27%
11,1663.1%
[
2.0%
-
2.5%
]
2.36%
11,9602.5%
[
2.0%
-
2.5%
]
2.42%
2072.5%
[
2.5%
-
3.0%
]
2.59%
24,7481.4%
[
2.5%
-
3.0%
]
2.69%
1,9731.5%
[
2.5%
-
3.0%
]
2.74%
45,9491.4%
[
2.5%
-
3.0%
]
2.88%
33,5411.7%
[
2.5%
-
3.0%
]
3.00%
3,1382.3%
[
3.0%
-
3.5%
]
3.06%
987.4%
[
3.0%
-
3.5%
]
3.15%
4,7911.3%
[
3.0%
-
3.5%
]
3.25%
19,7593.6%
[
3.0%
-
3.5%
]
3.39%
5,2264.8%
[
3.5%
-
4.0%
]
3.58%
9233.5%
[
3.5%
-
4.0%
]
3.81%
6571.4%
[
4.0%
-
4.5%
]
4.16%
1,5395.8%
[
4.0%
-
4.5%
]
4.50%
2,7149.4%
[
4.5%
-
5.0%
]
4.59%
5012.1%
[
4.5%
-
5.0%
]
4.77%
8,2872.8%
[
4.5%
-
5.0%
]
4.94%
1,5191.1%
[
5.0%
-
5.5%
]
5.32%
14,7891.9%
[
6.0%
-
6.5%
]
6.33%
11,9062.0%
[
9.0%
-
9.5%
]
9.49%
5691.1%
[
9.5%
-
10.0%
]
9.56%
4,7710.069%
[
20.0%
-
20.5%
]
20.03%
5841.4%