Immigrants from Costa Rica 1 or more Vehicles in Household

COMPARE

Immigrants from Costa Rica
Race
Ancestry
AfghanAfricanAlaska NativeAlaskan AthabascanAlbanianAleutAlsatianAmericanApacheArabArapahoArgentineanArmenianAssyrian/Chaldean/SyriacAustralianAustrianBahamianBangladeshiBarbadianBasqueBelgianBelizeanBermudanBhutaneseBlackfeetBolivianBrazilianBritishBritish West IndianBulgarianBurmeseCajunCambodianCanadianCape VerdeanCarpatho RusynCelticCentral AmericanCentral American IndianCherokeeCheyenneChickasawChileanChineseChippewaChoctawColombianColvilleComancheCosta RicanCreeCreekCroatianCrowCubanCypriotCzechCzechoslovakianDanishDelawareDominicanDutchDutch West IndianEastern EuropeanEcuadorianEgyptianEnglishEstonianEthiopianEuropeanFijianFilipinoFinnishFrenchFrench American IndianFrench CanadianGermanGerman RussianGhanaianGreekGuamanian/ChamorroGuatemalanGuyaneseHaitianHmongHonduranHopiHoumaHungarianIcelanderIndian (Asian)IndonesianInupiatIranianIraqiIrishIroquoisIsraeliItalianJamaicanJapaneseJordanianKenyanKiowaKoreanLaotianLatvianLebaneseLiberianLithuanianLumbeeLuxembourgerMacedonianMalaysianMalteseMarshalleseMenomineeMexicanMexican American IndianMongolianMoroccanNative HawaiianNavajoNepaleseNew ZealanderNicaraguanNigerianNorthern EuropeanNorwegianOkinawanOsageOttawaPaiutePakistaniPalestinianPanamanianParaguayanPennsylvania GermanPeruvianPimaPolishPortuguesePotawatomiPuebloPuerto RicanPuget Sound SalishRomanianRussianSalvadoranSamoanScandinavianScotch-IrishScottishSeminoleSenegaleseSerbianShoshoneSierra LeoneanSiouxSlavicSlovakSloveneSomaliSouth AfricanSouth AmericanSouth American IndianSoviet UnionSpaniardSpanishSpanish AmericanSpanish American IndianSri LankanSubsaharan AfricanSudaneseSwedishSwissSyrianTaiwaneseThaiTlingit-HaidaTohono O'OdhamTonganTrinidadian and TobagonianTsimshianTurkishU.S. Virgin IslanderUgandanUkrainianUruguayanUteVenezuelanVietnameseWelshWest IndianYakamaYaquiYugoslavianYumanYup'ikZimbabwean
Immigration
NonimmigrantsImmigrantsAfghanistanAfricaAlbaniaArgentinaArmeniaAsiaAustraliaAustriaBahamasBangladeshBarbadosBelarusBelgiumBelizeBoliviaBosnia and HerzegovinaBrazilBulgariaBurma/MyanmarCabo VerdeCambodiaCameroonCanadaCaribbeanCentral AmericaChileChinaColombiaCongoCosta RicaCroatiaCubaCzechoslovakiaDenmarkDominicaDominican RepublicEastern AfricaEastern AsiaEastern EuropeEcuadorEgyptEl SalvadorEnglandEritreaEthiopiaEuropeFijiFranceGermanyGhanaGreeceGrenadaGuatemalaGuyanaHaitiHondurasHong KongHungaryIndiaIndonesiaIranIraqIrelandIsraelItalyJamaicaJapanJordanKazakhstanKenyaKoreaKuwaitLaosLatin AmericaLatviaLebanonLiberiaLithuaniaMalaysiaMexicoMicronesiaMiddle AfricaMoldovaMoroccoNepalNetherlandsNicaraguaNigeriaNorth AmericaNorth MacedoniaNorthern AfricaNorthern EuropeNorwayOceaniaPakistanPanamaPeruPhilippinesPolandPortugalRomaniaRussiaSaudi ArabiaScotlandSenegalSerbiaSierra LeoneSingaporeSomaliaSouth AfricaSouth AmericaSouth Central AsiaSouth Eastern AsiaSouthern EuropeSpainSri LankaSt. Vincent and the GrenadinesSudanSwedenSwitzerlandSyriaTaiwanThailandTrinidad and TobagoTurkeyUgandaUkraineUruguayUzbekistanVenezuelaVietnamWest IndiesWestern AfricaWestern AsiaWestern EuropeYemenZaireZimbabweAzores
Select to Compare
Race
Ancestry
AfghanAfricanAlaska NativeAlaskan AthabascanAlbanianAleutAlsatianAmericanApacheArabArapahoArgentineanArmenianAssyrian/Chaldean/SyriacAustralianAustrianBahamianBangladeshiBarbadianBasqueBelgianBelizeanBermudanBhutaneseBlackfeetBolivianBrazilianBritishBritish West IndianBulgarianBurmeseCajunCambodianCanadianCape VerdeanCarpatho RusynCelticCentral AmericanCentral American IndianCherokeeCheyenneChickasawChileanChineseChippewaChoctawColombianColvilleComancheCosta RicanCreeCreekCroatianCrowCubanCypriotCzechCzechoslovakianDanishDelawareDominicanDutchDutch West IndianEastern EuropeanEcuadorianEgyptianEnglishEstonianEthiopianEuropeanFijianFilipinoFinnishFrenchFrench American IndianFrench CanadianGermanGerman RussianGhanaianGreekGuamanian/ChamorroGuatemalanGuyaneseHaitianHmongHonduranHopiHoumaHungarianIcelanderIndian (Asian)IndonesianInupiatIranianIraqiIrishIroquoisIsraeliItalianJamaicanJapaneseJordanianKenyanKiowaKoreanLaotianLatvianLebaneseLiberianLithuanianLumbeeLuxembourgerMacedonianMalaysianMalteseMarshalleseMenomineeMexicanMexican American IndianMongolianMoroccanNative HawaiianNavajoNepaleseNew ZealanderNicaraguanNigerianNorthern EuropeanNorwegianOkinawanOsageOttawaPaiutePakistaniPalestinianPanamanianParaguayanPennsylvania GermanPeruvianPimaPolishPortuguesePotawatomiPuebloPuerto RicanPuget Sound SalishRomanianRussianSalvadoranSamoanScandinavianScotch-IrishScottishSeminoleSenegaleseSerbianShoshoneSierra LeoneanSiouxSlavicSlovakSloveneSomaliSouth AfricanSouth AmericanSouth American IndianSoviet UnionSpaniardSpanishSpanish AmericanSpanish American IndianSri LankanSubsaharan AfricanSudaneseSwedishSwissSyrianTaiwaneseThaiTlingit-HaidaTohono O'OdhamTonganTrinidadian and TobagonianTsimshianTurkishU.S. Virgin IslanderUgandanUkrainianUruguayanUteVenezuelanVietnameseWelshWest IndianYakamaYaquiYugoslavianYumanYup'ikZimbabwean
Immigration
NonimmigrantsImmigrantsAfghanistanAfricaAlbaniaArgentinaArmeniaAsiaAustraliaAustriaBahamasBangladeshBarbadosBelarusBelgiumBelizeBoliviaBosnia and HerzegovinaBrazilBulgariaBurma/MyanmarCabo VerdeCambodiaCameroonCanadaCaribbeanCentral AmericaChileChinaColombiaCongoCroatiaCubaCzechoslovakiaDenmarkDominicaDominican RepublicEastern AfricaEastern AsiaEastern EuropeEcuadorEgyptEl SalvadorEnglandEritreaEthiopiaEuropeFijiFranceGermanyGhanaGreeceGrenadaGuatemalaGuyanaHaitiHondurasHong KongHungaryIndiaIndonesiaIranIraqIrelandIsraelItalyJamaicaJapanJordanKazakhstanKenyaKoreaKuwaitLaosLatin AmericaLatviaLebanonLiberiaLithuaniaMalaysiaMexicoMicronesiaMiddle AfricaMoldovaMoroccoNepalNetherlandsNicaraguaNigeriaNorth AmericaNorth MacedoniaNorthern AfricaNorthern EuropeNorwayOceaniaPakistanPanamaPeruPhilippinesPolandPortugalRomaniaRussiaSaudi ArabiaScotlandSenegalSerbiaSierra LeoneSingaporeSomaliaSouth AfricaSouth AmericaSouth Central AsiaSouth Eastern AsiaSouthern EuropeSpainSri LankaSt. Vincent and the GrenadinesSudanSwedenSwitzerlandSyriaTaiwanThailandTrinidad and TobagoTurkeyUgandaUkraineUruguayUzbekistanVenezuelaVietnamWest IndiesWestern AfricaWestern AsiaWestern EuropeYemenZaireZimbabweAzores
1 or more Vehicles in Household
Income
Poverty
Unemployment
Labor Participation
Family Structure
Vehicle Availability
Education Level
Disability

Immigrants from Costa Rica 1 or more Vehicles in Household
Average

89.8%
1+ VEHICLES AVAILABLE
57.6/ 100
METRIC RATING
170th/ 347
METRIC RANK

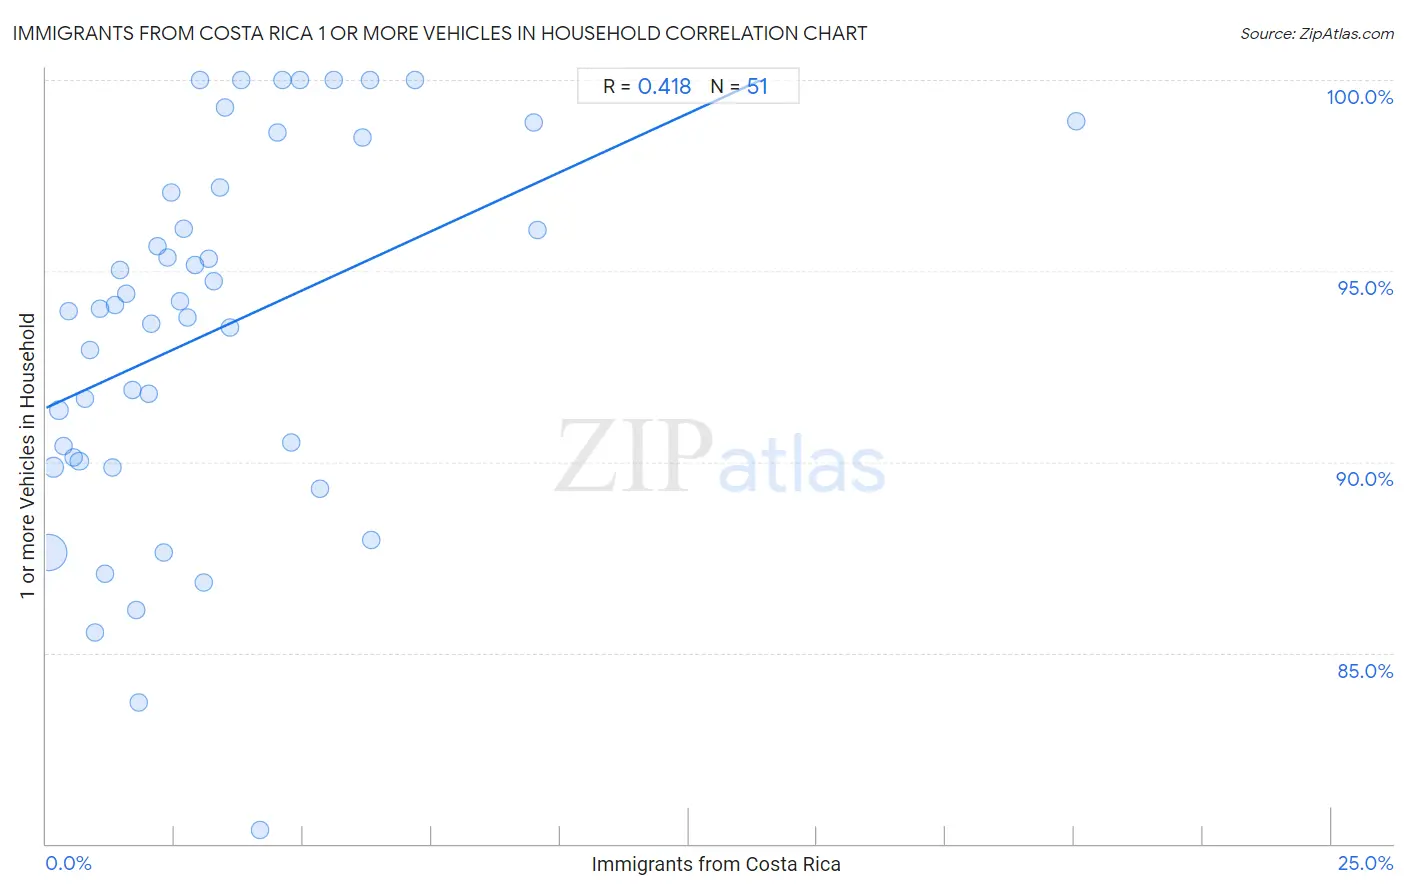
Immigrants from Costa Rica 1 or more Vehicles in Household Correlation Chart

The statistical analysis conducted on geographies consisting of 204,257,602 people shows a moderate positive correlation between the proportion of Immigrants from Costa Rica and percentage of households with 1 or more vehicles available in the United States with a correlation coefficient (R) of 0.418 and weighted average of 89.8%. On average, for every 1% (one percent) increase in Immigrants from Costa Rica within a typical geography, there is an increase of 0.62% in percentage of households with 1 or more vehicles available.
Immigrants from Costa Rica 1 or more Vehicles in Household
It is essential to understand that the correlation between the percentage of Immigrants from Costa Rica and percentage of households with 1 or more vehicles available does not imply a direct cause-and-effect relationship. It remains uncertain whether the presence of Immigrants from Costa Rica influences an upward or downward trend in the level of percentage of households with 1 or more vehicles available within an area, or if Immigrants from Costa Rica simply ended up residing in those areas with higher or lower levels of percentage of households with 1 or more vehicles available due to other factors.

Demographics Similar to Immigrants from Costa Rica by 1 or more Vehicles in Household

In terms of 1 or more vehicles in household, the demographic groups most similar to Immigrants from Costa Rica are Native/Alaskan (89.8%, a difference of 0.030%), Immigrants from Latin America (89.8%, a difference of 0.040%), Immigrants from Cambodia (89.8%, a difference of 0.040%), French American Indian (89.8%, a difference of 0.050%), and Indonesian (89.7%, a difference of 0.070%).
DemographicsRating | Rank1 or more Vehicles in Household
Immigrants from Austria
65.5
/100
|
#163
Good
89.9%
Comanche
63.4
/100
|
#164
Good
89.9%
Immigrants from Saudi Arabia
62.6
/100
|
#165
Good
89.9%
Immigrants from Middle Africa
62.2
/100
|
#166
Good
89.9%
Immigrants from Latin America
60.3
/100
|
#167
Good
89.8%
Immigrants from Cambodia
60.1
/100
|
#168
Good
89.8%
Natives/Alaskans
59.5
/100
|
#169
Average
89.8%
Immigrants from Costa Rica
57.6
/100
|
#170
Average
89.8%
French American Indians
54.4
/100
|
#171
Average
89.8%
Indonesians
53.0
/100
|
#172
Average
89.7%
Lumbee
52.8
/100
|
#173
Average
89.7%
Filipinos
50.0
/100
|
#174
Average
89.7%
Immigrants from Burma/Myanmar
47.6
/100
|
#175
Average
89.7%
Immigrants from Sudan
47.1
/100
|
#176
Average
89.7%
Hmong
45.8
/100
|
#177
Average
89.6%

Immigrants from Costa Rica 1 or more Vehicles in Household Correlation Summary

MeasurementImmigrants from Costa Rica Data1 or more Vehicles in Household Data
Minimum0.037%80.3%
Maximum20.0%100.0%
Range20.0%19.7%
Mean3.3%93.4%
Median2.6%94.0%
Interquartile 25% (IQ1)1.3%90.0%
Interquartile 75% (IQ3)4.5%97.2%
Interquartile Range (IQR)3.2%7.2%
Standard Deviation (Sample)3.3%4.8%
Standard Deviation (Population)3.2%4.8%

Correlation Details

Immigrants from Costa Rica PercentileSample Size1 or more Vehicles in Household
[
0.0%
-
0.5%
]
0.037%
161,390,45787.6%
[
0.0%
-
0.5%
]
0.14%
25,343,99989.9%
[
0.0%
-
0.5%
]
0.25%
8,008,22391.4%
[
0.0%
-
0.5%
]
0.34%
3,470,75290.4%
[
0.0%
-
0.5%
]
0.44%
1,721,22193.9%
[
0.5%
-
1.0%
]
0.54%
1,206,71290.1%
[
0.5%
-
1.0%
]
0.64%
988,49090.0%
[
0.5%
-
1.0%
]
0.74%
405,75291.7%
[
0.5%
-
1.0%
]
0.84%
381,48192.9%
[
0.5%
-
1.0%
]
0.95%
236,55785.5%
[
1.0%
-
1.5%
]
1.05%
232,11194.0%
[
1.0%
-
1.5%
]
1.14%
121,88387.1%
[
1.0%
-
1.5%
]
1.28%
218,78489.9%
[
1.0%
-
1.5%
]
1.33%
59,68194.1%
[
1.0%
-
1.5%
]
1.44%
54,04595.0%
[
1.5%
-
2.0%
]
1.56%
5,32494.4%
[
1.5%
-
2.0%
]
1.67%
72,62891.9%
[
1.5%
-
2.0%
]
1.74%
4,58986.1%
[
1.5%
-
2.0%
]
1.81%
28,52183.7%
[
1.5%
-
2.0%
]
1.98%
52,93891.8%
[
2.0%
-
2.5%
]
2.05%
9,26693.6%
[
2.0%
-
2.5%
]
2.17%
26,62495.7%
[
2.0%
-
2.5%
]
2.27%
11,16687.6%
[
2.0%
-
2.5%
]
2.36%
13,41795.3%
[
2.0%
-
2.5%
]
2.43%
32997.1%
[
2.5%
-
3.0%
]
2.59%
24,74894.2%
[
2.5%
-
3.0%
]
2.67%
2,66196.1%
[
2.5%
-
3.0%
]
2.74%
45,94993.8%
[
2.5%
-
3.0%
]
2.88%
33,54195.2%
[
2.5%
-
3.0%
]
3.00%
3,138100.0%
[
3.0%
-
3.5%
]
3.06%
9886.8%
[
3.0%
-
3.5%
]
3.15%
4,79195.3%
[
3.0%
-
3.5%
]
3.25%
19,75994.7%
[
3.0%
-
3.5%
]
3.39%
5,22697.2%
[
3.0%
-
3.5%
]
3.47%
1,76099.3%
[
3.5%
-
4.0%
]
3.58%
92393.5%
[
3.5%
-
4.0%
]
3.81%
657100.0%
[
4.0%
-
4.5%
]
4.16%
1,53980.3%
[
4.0%
-
4.5%
]
4.50%
2,71498.6%
[
4.5%
-
5.0%
]
4.59%
501100.0%
[
4.5%
-
5.0%
]
4.77%
8,28790.5%
[
4.5%
-
5.0%
]
4.94%
1,519100.0%
[
5.0%
-
5.5%
]
5.32%
14,78989.3%
[
5.5%
-
6.0%
]
5.59%
143100.0%
[
6.0%
-
6.5%
]
6.15%
1,59498.5%
[
6.0%
-
6.5%
]
6.29%
318100.0%
[
6.0%
-
6.5%
]
6.33%
11,90688.0%
[
7.0%
-
7.5%
]
7.19%
167100.0%
[
9.0%
-
9.5%
]
9.49%
56998.9%
[
9.5%
-
10.0%
]
9.56%
4,77196.1%
[
20.0%
-
20.5%
]
20.03%
58498.9%