Immigrants from Cameroon 4 or more Vehicles in Household

COMPARE

Immigrants from Cameroon
Race
Ancestry
AfghanAfricanAlaska NativeAlaskan AthabascanAlbanianAleutAlsatianAmericanApacheArabArapahoArgentineanArmenianAssyrian/Chaldean/SyriacAustralianAustrianBahamianBangladeshiBarbadianBasqueBelgianBelizeanBermudanBhutaneseBlackfeetBolivianBrazilianBritishBritish West IndianBulgarianBurmeseCajunCambodianCanadianCape VerdeanCarpatho RusynCelticCentral AmericanCentral American IndianCherokeeCheyenneChickasawChileanChineseChippewaChoctawColombianColvilleComancheCosta RicanCreeCreekCroatianCrowCubanCypriotCzechCzechoslovakianDanishDelawareDominicanDutchDutch West IndianEastern EuropeanEcuadorianEgyptianEnglishEstonianEthiopianEuropeanFijianFilipinoFinnishFrenchFrench American IndianFrench CanadianGermanGerman RussianGhanaianGreekGuamanian/ChamorroGuatemalanGuyaneseHaitianHmongHonduranHopiHoumaHungarianIcelanderIndian (Asian)IndonesianInupiatIranianIraqiIrishIroquoisIsraeliItalianJamaicanJapaneseJordanianKenyanKiowaKoreanLaotianLatvianLebaneseLiberianLithuanianLumbeeLuxembourgerMacedonianMalaysianMalteseMarshalleseMenomineeMexicanMexican American IndianMongolianMoroccanNative HawaiianNavajoNepaleseNew ZealanderNicaraguanNigerianNorthern EuropeanNorwegianOkinawanOsageOttawaPaiutePakistaniPalestinianPanamanianParaguayanPennsylvania GermanPeruvianPimaPolishPortuguesePotawatomiPuebloPuerto RicanPuget Sound SalishRomanianRussianSalvadoranSamoanScandinavianScotch-IrishScottishSeminoleSenegaleseSerbianShoshoneSierra LeoneanSiouxSlavicSlovakSloveneSomaliSouth AfricanSouth AmericanSouth American IndianSoviet UnionSpaniardSpanishSpanish AmericanSpanish American IndianSri LankanSubsaharan AfricanSudaneseSwedishSwissSyrianTaiwaneseThaiTlingit-HaidaTohono O'OdhamTonganTrinidadian and TobagonianTsimshianTurkishU.S. Virgin IslanderUgandanUkrainianUruguayanUteVenezuelanVietnameseWelshWest IndianYakamaYaquiYugoslavianYumanYup'ikZimbabwean
Immigration
NonimmigrantsImmigrantsAfghanistanAfricaAlbaniaArgentinaArmeniaAsiaAustraliaAustriaBahamasBangladeshBarbadosBelarusBelgiumBelizeBoliviaBosnia and HerzegovinaBrazilBulgariaBurma/MyanmarCabo VerdeCambodiaCameroonCanadaCaribbeanCentral AmericaChileChinaColombiaCongoCosta RicaCroatiaCubaCzechoslovakiaDenmarkDominicaDominican RepublicEastern AfricaEastern AsiaEastern EuropeEcuadorEgyptEl SalvadorEnglandEritreaEthiopiaEuropeFijiFranceGermanyGhanaGreeceGrenadaGuatemalaGuyanaHaitiHondurasHong KongHungaryIndiaIndonesiaIranIraqIrelandIsraelItalyJamaicaJapanJordanKazakhstanKenyaKoreaKuwaitLaosLatin AmericaLatviaLebanonLiberiaLithuaniaMalaysiaMexicoMicronesiaMiddle AfricaMoldovaMoroccoNepalNetherlandsNicaraguaNigeriaNorth AmericaNorth MacedoniaNorthern AfricaNorthern EuropeNorwayOceaniaPakistanPanamaPeruPhilippinesPolandPortugalRomaniaRussiaSaudi ArabiaScotlandSenegalSerbiaSierra LeoneSingaporeSomaliaSouth AfricaSouth AmericaSouth Central AsiaSouth Eastern AsiaSouthern EuropeSpainSri LankaSt. Vincent and the GrenadinesSudanSwedenSwitzerlandSyriaTaiwanThailandTrinidad and TobagoTurkeyUgandaUkraineUruguayUzbekistanVenezuelaVietnamWest IndiesWestern AfricaWestern AsiaWestern EuropeYemenZaireZimbabweAzores
Select to Compare
Race
Ancestry
AfghanAfricanAlaska NativeAlaskan AthabascanAlbanianAleutAlsatianAmericanApacheArabArapahoArgentineanArmenianAssyrian/Chaldean/SyriacAustralianAustrianBahamianBangladeshiBarbadianBasqueBelgianBelizeanBermudanBhutaneseBlackfeetBolivianBrazilianBritishBritish West IndianBulgarianBurmeseCajunCambodianCanadianCape VerdeanCarpatho RusynCelticCentral AmericanCentral American IndianCherokeeCheyenneChickasawChileanChineseChippewaChoctawColombianColvilleComancheCosta RicanCreeCreekCroatianCrowCubanCypriotCzechCzechoslovakianDanishDelawareDominicanDutchDutch West IndianEastern EuropeanEcuadorianEgyptianEnglishEstonianEthiopianEuropeanFijianFilipinoFinnishFrenchFrench American IndianFrench CanadianGermanGerman RussianGhanaianGreekGuamanian/ChamorroGuatemalanGuyaneseHaitianHmongHonduranHopiHoumaHungarianIcelanderIndian (Asian)IndonesianInupiatIranianIraqiIrishIroquoisIsraeliItalianJamaicanJapaneseJordanianKenyanKiowaKoreanLaotianLatvianLebaneseLiberianLithuanianLumbeeLuxembourgerMacedonianMalaysianMalteseMarshalleseMenomineeMexicanMexican American IndianMongolianMoroccanNative HawaiianNavajoNepaleseNew ZealanderNicaraguanNigerianNorthern EuropeanNorwegianOkinawanOsageOttawaPaiutePakistaniPalestinianPanamanianParaguayanPennsylvania GermanPeruvianPimaPolishPortuguesePotawatomiPuebloPuerto RicanPuget Sound SalishRomanianRussianSalvadoranSamoanScandinavianScotch-IrishScottishSeminoleSenegaleseSerbianShoshoneSierra LeoneanSiouxSlavicSlovakSloveneSomaliSouth AfricanSouth AmericanSouth American IndianSoviet UnionSpaniardSpanishSpanish AmericanSpanish American IndianSri LankanSubsaharan AfricanSudaneseSwedishSwissSyrianTaiwaneseThaiTlingit-HaidaTohono O'OdhamTonganTrinidadian and TobagonianTsimshianTurkishU.S. Virgin IslanderUgandanUkrainianUruguayanUteVenezuelanVietnameseWelshWest IndianYakamaYaquiYugoslavianYumanYup'ikZimbabwean
Immigration
NonimmigrantsImmigrantsAfghanistanAfricaAlbaniaArgentinaArmeniaAsiaAustraliaAustriaBahamasBangladeshBarbadosBelarusBelgiumBelizeBoliviaBosnia and HerzegovinaBrazilBulgariaBurma/MyanmarCabo VerdeCambodiaCanadaCaribbeanCentral AmericaChileChinaColombiaCongoCosta RicaCroatiaCubaCzechoslovakiaDenmarkDominicaDominican RepublicEastern AfricaEastern AsiaEastern EuropeEcuadorEgyptEl SalvadorEnglandEritreaEthiopiaEuropeFijiFranceGermanyGhanaGreeceGrenadaGuatemalaGuyanaHaitiHondurasHong KongHungaryIndiaIndonesiaIranIraqIrelandIsraelItalyJamaicaJapanJordanKazakhstanKenyaKoreaKuwaitLaosLatin AmericaLatviaLebanonLiberiaLithuaniaMalaysiaMexicoMicronesiaMiddle AfricaMoldovaMoroccoNepalNetherlandsNicaraguaNigeriaNorth AmericaNorth MacedoniaNorthern AfricaNorthern EuropeNorwayOceaniaPakistanPanamaPeruPhilippinesPolandPortugalRomaniaRussiaSaudi ArabiaScotlandSenegalSerbiaSierra LeoneSingaporeSomaliaSouth AfricaSouth AmericaSouth Central AsiaSouth Eastern AsiaSouthern EuropeSpainSri LankaSt. Vincent and the GrenadinesSudanSwedenSwitzerlandSyriaTaiwanThailandTrinidad and TobagoTurkeyUgandaUkraineUruguayUzbekistanVenezuelaVietnamWest IndiesWestern AfricaWestern AsiaWestern EuropeYemenZaireZimbabweAzores
4 or more Vehicles in Household
Income
Poverty
Unemployment
Labor Participation
Family Structure
Vehicle Availability
Education Level
Disability

Immigrants from Cameroon 4 or more Vehicles in Household
Good

6.4%
4+ VEHICLES AVAILABLE
64.4/ 100
METRIC RATING
161st/ 347
METRIC RANK

Immigrants from Cameroon 4 or more Vehicles in Household Correlation Chart

The statistical analysis conducted on geographies consisting of 130,454,294 people shows a moderate positive correlation between the proportion of Immigrants from Cameroon and percentage of households with 4 or more vehicles available in the United States with a correlation coefficient (R) of 0.499 and weighted average of 6.4%. On average, for every 1% (one percent) increase in Immigrants from Cameroon within a typical geography, there is an increase of 0.85% in percentage of households with 4 or more vehicles available.
Immigrants from Cameroon 4 or more Vehicles in Household
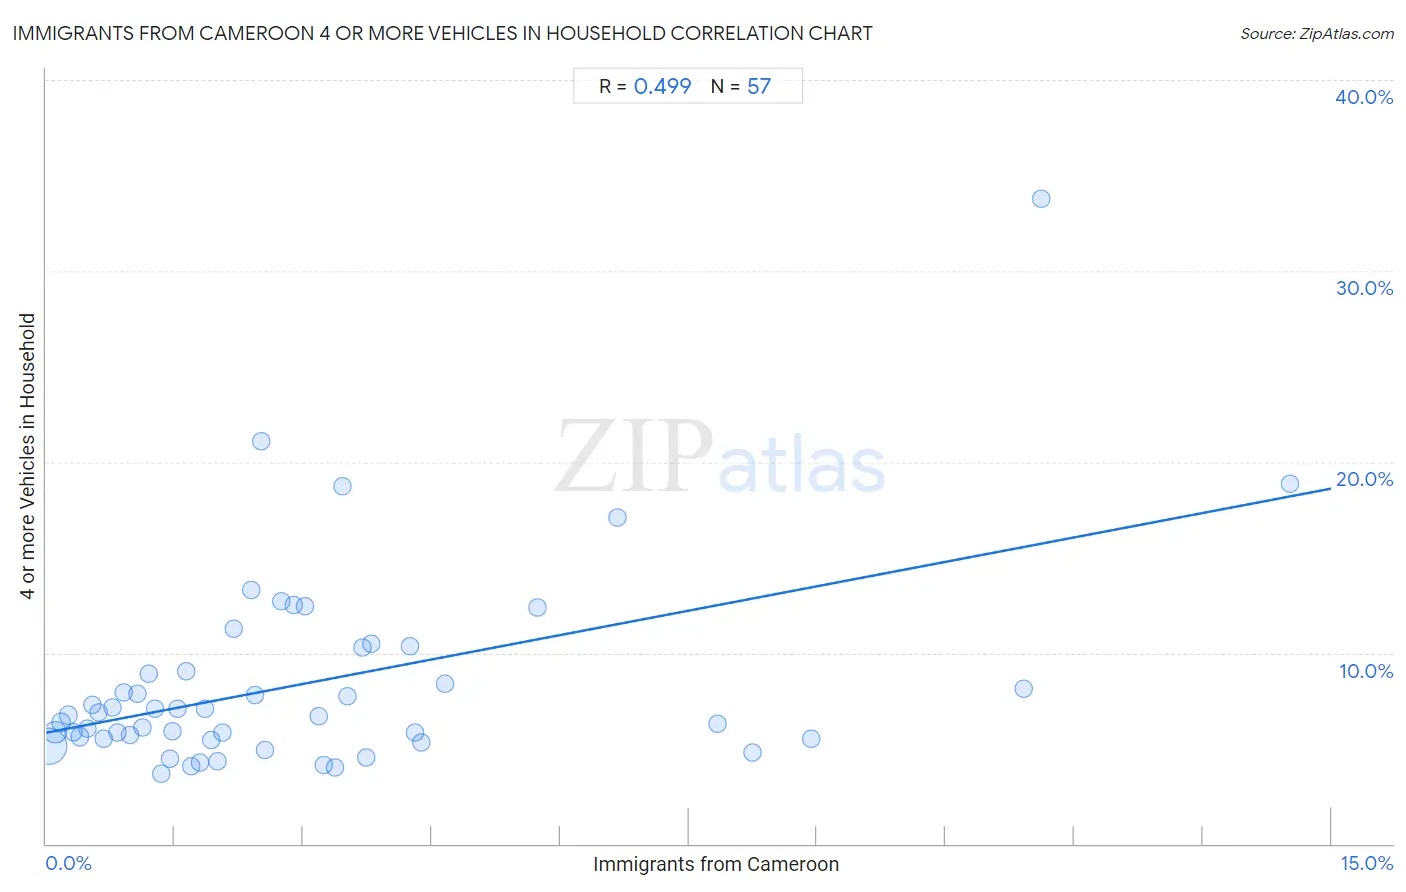
It is essential to understand that the correlation between the percentage of Immigrants from Cameroon and percentage of households with 4 or more vehicles available does not imply a direct cause-and-effect relationship. It remains uncertain whether the presence of Immigrants from Cameroon influences an upward or downward trend in the level of percentage of households with 4 or more vehicles available within an area, or if Immigrants from Cameroon simply ended up residing in those areas with higher or lower levels of percentage of households with 4 or more vehicles available due to other factors.

Demographics Similar to Immigrants from Cameroon by 4 or more Vehicles in Household

In terms of 4 or more vehicles in household, the demographic groups most similar to Immigrants from Cameroon are Immigrants from Pakistan (6.4%, a difference of 0.13%), Palestinian (6.4%, a difference of 0.15%), Indian (Asian) (6.4%, a difference of 0.21%), Zimbabwean (6.4%, a difference of 0.30%), and Chilean (6.4%, a difference of 0.34%).
DemographicsRating | Rank4 or more Vehicles in Household
Central American Indians
71.1
/100
|
#154
Good
6.5%
Iroquois
70.4
/100
|
#155
Good
6.5%
Iranians
69.9
/100
|
#156
Good
6.5%
Peruvians
69.4
/100
|
#157
Good
6.5%
Zimbabweans
67.1
/100
|
#158
Good
6.4%
Indians (Asian)
66.3
/100
|
#159
Good
6.4%
Palestinians
65.8
/100
|
#160
Good
6.4%
Immigrants from Cameroon
64.4
/100
|
#161
Good
6.4%
Immigrants from Pakistan
63.2
/100
|
#162
Good
6.4%
Chileans
61.2
/100
|
#163
Good
6.4%
Hungarians
61.1
/100
|
#164
Good
6.4%
Immigrants from Peru
59.8
/100
|
#165
Average
6.4%
Immigrants from Denmark
57.8
/100
|
#166
Average
6.4%
Poles
56.9
/100
|
#167
Average
6.4%
Lebanese
55.8
/100
|
#168
Average
6.4%

Immigrants from Cameroon 4 or more Vehicles in Household Correlation Summary

MeasurementImmigrants from Cameroon Data4 or more Vehicles in Household Data
Minimum0.024%3.7%
Maximum14.5%33.8%
Range14.5%30.1%
Mean3.0%8.4%
Median2.1%6.7%
Interquartile 25% (IQ1)1.0%5.5%
Interquartile 75% (IQ3)3.7%9.6%
Interquartile Range (IQR)2.7%4.1%
Standard Deviation (Sample)3.0%5.2%
Standard Deviation (Population)3.0%5.2%

Correlation Details

Immigrants from Cameroon PercentileSample Size4 or more Vehicles in Household
[
0.0%
-
0.5%
]
0.024%
87,785,1845.1%
[
0.0%
-
0.5%
]
0.11%
20,414,5095.8%
[
0.0%
-
0.5%
]
0.18%
7,137,7706.4%
[
0.0%
-
0.5%
]
0.26%
4,084,5796.7%
[
0.0%
-
0.5%
]
0.32%
2,553,0795.8%
[
0.0%
-
0.5%
]
0.39%
1,399,2865.6%
[
0.0%
-
0.5%
]
0.48%
1,121,5006.0%
[
0.5%
-
1.0%
]
0.54%
1,367,6577.3%
[
0.5%
-
1.0%
]
0.61%
882,4906.9%
[
0.5%
-
1.0%
]
0.67%
467,0575.5%
[
0.5%
-
1.0%
]
0.77%
331,5507.1%
[
0.5%
-
1.0%
]
0.83%
380,9535.8%
[
0.5%
-
1.0%
]
0.90%
395,3427.9%
[
0.5%
-
1.0%
]
0.97%
245,3865.7%
[
1.0%
-
1.5%
]
1.06%
194,2467.9%
[
1.0%
-
1.5%
]
1.12%
112,3976.1%
[
1.0%
-
1.5%
]
1.19%
233,8738.9%
[
1.0%
-
1.5%
]
1.27%
55,5287.1%
[
1.0%
-
1.5%
]
1.34%
132,7213.7%
[
1.0%
-
1.5%
]
1.44%
73,4324.4%
[
1.0%
-
1.5%
]
1.47%
24,0495.9%
[
1.5%
-
2.0%
]
1.54%
17,3137.1%
[
1.5%
-
2.0%
]
1.63%
134,0949.0%
[
1.5%
-
2.0%
]
1.69%
58,8354.1%
[
1.5%
-
2.0%
]
1.79%
33,4764.3%
[
1.5%
-
2.0%
]
1.85%
156,1267.1%
[
1.5%
-
2.0%
]
1.93%
2,2815.4%
[
1.5%
-
2.0%
]
2.00%
59,3794.3%
[
2.0%
-
2.5%
]
2.05%
40,6075.8%
[
2.0%
-
2.5%
]
2.19%
6,34111.2%
[
2.0%
-
2.5%
]
2.39%
33,42013.3%
[
2.0%
-
2.5%
]
2.44%
49,6587.8%
[
2.5%
-
3.0%
]
2.51%
2,03421.1%
[
2.5%
-
3.0%
]
2.55%
20,8334.9%
[
2.5%
-
3.0%
]
2.75%
3,89612.7%
[
2.5%
-
3.0%
]
2.89%
38,78212.5%
[
3.0%
-
3.5%
]
3.02%
12,10312.4%
[
3.0%
-
3.5%
]
3.18%
75,9016.7%
[
3.0%
-
3.5%
]
3.23%
58,0934.1%
[
3.0%
-
3.5%
]
3.37%
6,6384.0%
[
3.0%
-
3.5%
]
3.46%
11,66218.7%
[
3.5%
-
4.0%
]
3.52%
8,2907.7%
[
3.5%
-
4.0%
]
3.69%
2,33010.2%
[
3.5%
-
4.0%
]
3.73%
24,6464.5%
[
3.5%
-
4.0%
]
3.79%
12,12810.5%
[
4.0%
-
4.5%
]
4.24%
75,98810.4%
[
4.0%
-
4.5%
]
4.30%
28,4275.8%
[
4.0%
-
4.5%
]
4.38%
27,9095.3%
[
4.5%
-
5.0%
]
4.65%
16,9448.4%
[
5.5%
-
6.0%
]
5.73%
5,04112.4%
[
6.5%
-
7.0%
]
6.67%
2,69917.1%
[
7.5%
-
8.0%
]
7.84%
13,5806.3%
[
8.0%
-
8.5%
]
8.24%
15,4894.8%
[
8.5%
-
9.0%
]
8.92%
3,1045.5%
[
11.0%
-
11.5%
]
11.42%
1,9978.1%
[
11.5%
-
12.0%
]
11.61%
42233.8%
[
14.5%
-
15.0%
]
14.52%
1,24018.8%