Immigrants from Cameroon Married-couple Households
COMPARE
Immigrants from Cameroon
Select to Compare
Married-couple Households
Immigrants from Cameroon Married-couple Households
43.7%
MARRIED-COUPLE HOUSEHOLDS
0.2/ 100
METRIC RATING
260th/ 347
METRIC RANK
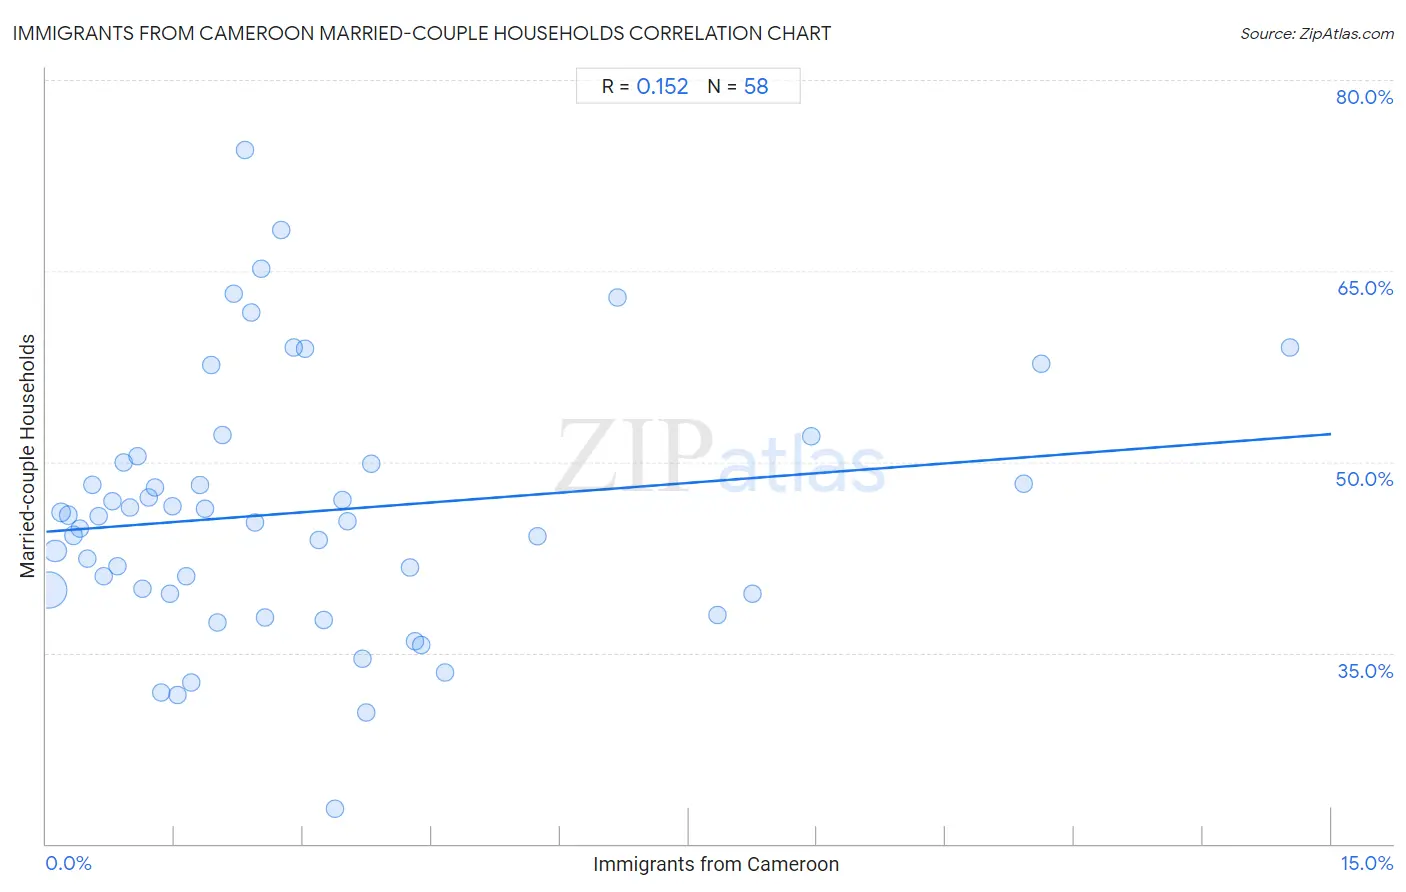
Immigrants from Cameroon Married-couple Households Correlation Chart
The statistical analysis conducted on geographies consisting of 130,731,618 people shows a poor positive correlation between the proportion of Immigrants from Cameroon and percentage of married-couple family households in the United States with a correlation coefficient (R) of 0.152 and weighted average of 43.7%. On average, for every 1% (one percent) increase in Immigrants from Cameroon within a typical geography, there is an increase of 0.51% in percentage of married-couple family households.
It is essential to understand that the correlation between the percentage of Immigrants from Cameroon and percentage of married-couple family households does not imply a direct cause-and-effect relationship. It remains uncertain whether the presence of Immigrants from Cameroon influences an upward or downward trend in the level of percentage of married-couple family households within an area, or if Immigrants from Cameroon simply ended up residing in those areas with higher or lower levels of percentage of married-couple family households due to other factors.
Demographics Similar to Immigrants from Cameroon by Married-couple Households
In terms of married-couple households, the demographic groups most similar to Immigrants from Cameroon are Iroquois (43.7%, a difference of 0.090%), Central American Indian (43.8%, a difference of 0.12%), Alaskan Athabascan (43.6%, a difference of 0.13%), Blackfeet (43.8%, a difference of 0.15%), and Vietnamese (43.6%, a difference of 0.19%).
| Demographics | Rating | Rank | Married-couple Households |
| Central Americans | 0.3 /100 | #253 | Tragic 43.9% |
| Apache | 0.3 /100 | #254 | Tragic 43.9% |
| Shoshone | 0.3 /100 | #255 | Tragic 43.9% |
| Ugandans | 0.3 /100 | #256 | Tragic 43.8% |
| Blackfeet | 0.2 /100 | #257 | Tragic 43.8% |
| Central American Indians | 0.2 /100 | #258 | Tragic 43.8% |
| Iroquois | 0.2 /100 | #259 | Tragic 43.7% |
| Immigrants from Cameroon | 0.2 /100 | #260 | Tragic 43.7% |
| Alaskan Athabascans | 0.2 /100 | #261 | Tragic 43.6% |
| Vietnamese | 0.2 /100 | #262 | Tragic 43.6% |
| Cree | 0.1 /100 | #263 | Tragic 43.6% |
| Bangladeshis | 0.1 /100 | #264 | Tragic 43.5% |
| Moroccans | 0.1 /100 | #265 | Tragic 43.5% |
| Ecuadorians | 0.1 /100 | #266 | Tragic 43.5% |
| Natives/Alaskans | 0.1 /100 | #267 | Tragic 43.5% |
Immigrants from Cameroon Married-couple Households Correlation Summary
| Measurement | Immigrants from Cameroon Data | Married-couple Households Data |
| Minimum | 0.024% | 22.8% |
| Maximum | 14.5% | 74.5% |
| Range | 14.5% | 51.8% |
| Mean | 3.0% | 46.0% |
| Median | 2.1% | 45.5% |
| Interquartile 25% (IQ1) | 1.1% | 39.6% |
| Interquartile 75% (IQ3) | 3.7% | 50.0% |
| Interquartile Range (IQR) | 2.6% | 10.4% |
| Standard Deviation (Sample) | 3.0% | 10.1% |
| Standard Deviation (Population) | 3.0% | 10.0% |
Correlation Details
| Immigrants from Cameroon Percentile | Sample Size | Married-couple Households |
[ 0.0% - 0.5% ] 0.024% | 87,891,309 | 39.9% |
[ 0.0% - 0.5% ] 0.11% | 20,472,455 | 43.0% |
[ 0.0% - 0.5% ] 0.18% | 7,217,407 | 46.0% |
[ 0.0% - 0.5% ] 0.26% | 4,086,042 | 45.8% |
[ 0.0% - 0.5% ] 0.32% | 2,554,901 | 44.2% |
[ 0.0% - 0.5% ] 0.39% | 1,400,080 | 44.8% |
[ 0.0% - 0.5% ] 0.48% | 1,121,500 | 42.4% |
[ 0.5% - 1.0% ] 0.54% | 1,373,969 | 48.2% |
[ 0.5% - 1.0% ] 0.61% | 895,996 | 45.8% |
[ 0.5% - 1.0% ] 0.67% | 468,871 | 41.0% |
[ 0.5% - 1.0% ] 0.77% | 331,550 | 47.0% |
[ 0.5% - 1.0% ] 0.83% | 380,953 | 41.8% |
[ 0.5% - 1.0% ] 0.90% | 395,895 | 50.0% |
[ 0.5% - 1.0% ] 0.97% | 246,279 | 46.5% |
[ 1.0% - 1.5% ] 1.06% | 194,246 | 50.5% |
[ 1.0% - 1.5% ] 1.12% | 113,214 | 40.1% |
[ 1.0% - 1.5% ] 1.19% | 233,873 | 47.2% |
[ 1.0% - 1.5% ] 1.27% | 55,528 | 48.0% |
[ 1.0% - 1.5% ] 1.34% | 132,721 | 31.8% |
[ 1.0% - 1.5% ] 1.44% | 73,432 | 39.6% |
[ 1.0% - 1.5% ] 1.47% | 26,453 | 46.5% |
[ 1.5% - 2.0% ] 1.54% | 17,313 | 31.7% |
[ 1.5% - 2.0% ] 1.63% | 134,094 | 41.0% |
[ 1.5% - 2.0% ] 1.69% | 58,835 | 32.7% |
[ 1.5% - 2.0% ] 1.79% | 33,476 | 48.2% |
[ 1.5% - 2.0% ] 1.85% | 156,988 | 46.3% |
[ 1.5% - 2.0% ] 1.93% | 2,281 | 57.6% |
[ 1.5% - 2.0% ] 2.00% | 59,379 | 37.3% |
[ 2.0% - 2.5% ] 2.05% | 40,607 | 52.1% |
[ 2.0% - 2.5% ] 2.19% | 6,341 | 63.2% |
[ 2.0% - 2.5% ] 2.31% | 2,376 | 74.5% |
[ 2.0% - 2.5% ] 2.39% | 33,420 | 61.7% |
[ 2.0% - 2.5% ] 2.44% | 49,658 | 45.3% |
[ 2.5% - 3.0% ] 2.51% | 2,034 | 65.2% |
[ 2.5% - 3.0% ] 2.55% | 20,833 | 37.8% |
[ 2.5% - 3.0% ] 2.75% | 3,896 | 68.2% |
[ 2.5% - 3.0% ] 2.89% | 38,782 | 59.0% |
[ 3.0% - 3.5% ] 3.02% | 12,103 | 58.9% |
[ 3.0% - 3.5% ] 3.18% | 75,901 | 43.9% |
[ 3.0% - 3.5% ] 3.23% | 58,093 | 37.6% |
[ 3.0% - 3.5% ] 3.37% | 6,638 | 22.8% |
[ 3.0% - 3.5% ] 3.46% | 11,662 | 47.0% |
[ 3.5% - 4.0% ] 3.52% | 8,290 | 45.3% |
[ 3.5% - 4.0% ] 3.69% | 2,330 | 34.6% |
[ 3.5% - 4.0% ] 3.73% | 24,646 | 30.3% |
[ 3.5% - 4.0% ] 3.79% | 12,128 | 49.8% |
[ 4.0% - 4.5% ] 4.24% | 75,988 | 41.7% |
[ 4.0% - 4.5% ] 4.30% | 28,427 | 35.9% |
[ 4.0% - 4.5% ] 4.38% | 27,909 | 35.6% |
[ 4.5% - 5.0% ] 4.65% | 16,944 | 33.5% |
[ 5.5% - 6.0% ] 5.73% | 5,041 | 44.2% |
[ 6.5% - 7.0% ] 6.67% | 2,699 | 62.9% |
[ 7.5% - 8.0% ] 7.84% | 13,580 | 38.0% |
[ 8.0% - 8.5% ] 8.24% | 15,489 | 39.6% |
[ 8.5% - 9.0% ] 8.92% | 3,104 | 52.0% |
[ 11.0% - 11.5% ] 11.42% | 1,997 | 48.3% |
[ 11.5% - 12.0% ] 11.61% | 422 | 57.7% |
[ 14.5% - 15.0% ] 14.52% | 1,240 | 58.9% |