Immigrants from Cameroon Wage/Income Gap

COMPARE

Immigrants from Cameroon
Race
Ancestry
AfghanAfricanAlaska NativeAlaskan AthabascanAlbanianAleutAlsatianAmericanApacheArabArapahoArgentineanArmenianAssyrian/Chaldean/SyriacAustralianAustrianBahamianBangladeshiBarbadianBasqueBelgianBelizeanBermudanBhutaneseBlackfeetBolivianBrazilianBritishBritish West IndianBulgarianBurmeseCajunCambodianCanadianCape VerdeanCarpatho RusynCelticCentral AmericanCentral American IndianCherokeeCheyenneChickasawChileanChineseChippewaChoctawColombianColvilleComancheCosta RicanCreeCreekCroatianCrowCubanCypriotCzechCzechoslovakianDanishDelawareDominicanDutchDutch West IndianEastern EuropeanEcuadorianEgyptianEnglishEstonianEthiopianEuropeanFijianFilipinoFinnishFrenchFrench American IndianFrench CanadianGermanGerman RussianGhanaianGreekGuamanian/ChamorroGuatemalanGuyaneseHaitianHmongHonduranHopiHoumaHungarianIcelanderIndian (Asian)IndonesianInupiatIranianIraqiIrishIroquoisIsraeliItalianJamaicanJapaneseJordanianKenyanKiowaKoreanLaotianLatvianLebaneseLiberianLithuanianLumbeeLuxembourgerMacedonianMalaysianMalteseMarshalleseMenomineeMexicanMexican American IndianMongolianMoroccanNative HawaiianNavajoNepaleseNew ZealanderNicaraguanNigerianNorthern EuropeanNorwegianOkinawanOsageOttawaPaiutePakistaniPalestinianPanamanianParaguayanPennsylvania GermanPeruvianPimaPolishPortuguesePotawatomiPuebloPuerto RicanPuget Sound SalishRomanianRussianSalvadoranSamoanScandinavianScotch-IrishScottishSeminoleSenegaleseSerbianShoshoneSierra LeoneanSiouxSlavicSlovakSloveneSomaliSouth AfricanSouth AmericanSouth American IndianSoviet UnionSpaniardSpanishSpanish AmericanSpanish American IndianSri LankanSubsaharan AfricanSudaneseSwedishSwissSyrianTaiwaneseThaiTlingit-HaidaTohono O'OdhamTonganTrinidadian and TobagonianTsimshianTurkishU.S. Virgin IslanderUgandanUkrainianUruguayanUteVenezuelanVietnameseWelshWest IndianYakamaYaquiYugoslavianYumanYup'ikZimbabwean
Immigration
NonimmigrantsImmigrantsAfghanistanAfricaAlbaniaArgentinaArmeniaAsiaAustraliaAustriaBahamasBangladeshBarbadosBelarusBelgiumBelizeBoliviaBosnia and HerzegovinaBrazilBulgariaBurma/MyanmarCabo VerdeCambodiaCameroonCanadaCaribbeanCentral AmericaChileChinaColombiaCongoCosta RicaCroatiaCubaCzechoslovakiaDenmarkDominicaDominican RepublicEastern AfricaEastern AsiaEastern EuropeEcuadorEgyptEl SalvadorEnglandEritreaEthiopiaEuropeFijiFranceGermanyGhanaGreeceGrenadaGuatemalaGuyanaHaitiHondurasHong KongHungaryIndiaIndonesiaIranIraqIrelandIsraelItalyJamaicaJapanJordanKazakhstanKenyaKoreaKuwaitLaosLatin AmericaLatviaLebanonLiberiaLithuaniaMalaysiaMexicoMicronesiaMiddle AfricaMoldovaMoroccoNepalNetherlandsNicaraguaNigeriaNorth AmericaNorth MacedoniaNorthern AfricaNorthern EuropeNorwayOceaniaPakistanPanamaPeruPhilippinesPolandPortugalRomaniaRussiaSaudi ArabiaScotlandSenegalSerbiaSierra LeoneSingaporeSomaliaSouth AfricaSouth AmericaSouth Central AsiaSouth Eastern AsiaSouthern EuropeSpainSri LankaSt. Vincent and the GrenadinesSudanSwedenSwitzerlandSyriaTaiwanThailandTrinidad and TobagoTurkeyUgandaUkraineUruguayUzbekistanVenezuelaVietnamWest IndiesWestern AfricaWestern AsiaWestern EuropeYemenZaireZimbabweAzores
Select to Compare
Race
Ancestry
AfghanAfricanAlaska NativeAlaskan AthabascanAlbanianAleutAlsatianAmericanApacheArabArapahoArgentineanArmenianAssyrian/Chaldean/SyriacAustralianAustrianBahamianBangladeshiBarbadianBasqueBelgianBelizeanBermudanBhutaneseBlackfeetBolivianBrazilianBritishBritish West IndianBulgarianBurmeseCajunCambodianCanadianCape VerdeanCarpatho RusynCelticCentral AmericanCentral American IndianCherokeeCheyenneChickasawChileanChineseChippewaChoctawColombianColvilleComancheCosta RicanCreeCreekCroatianCrowCubanCypriotCzechCzechoslovakianDanishDelawareDominicanDutchDutch West IndianEastern EuropeanEcuadorianEgyptianEnglishEstonianEthiopianEuropeanFijianFilipinoFinnishFrenchFrench American IndianFrench CanadianGermanGerman RussianGhanaianGreekGuamanian/ChamorroGuatemalanGuyaneseHaitianHmongHonduranHopiHoumaHungarianIcelanderIndian (Asian)IndonesianInupiatIranianIraqiIrishIroquoisIsraeliItalianJamaicanJapaneseJordanianKenyanKiowaKoreanLaotianLatvianLebaneseLiberianLithuanianLumbeeLuxembourgerMacedonianMalaysianMalteseMarshalleseMenomineeMexicanMexican American IndianMongolianMoroccanNative HawaiianNavajoNepaleseNew ZealanderNicaraguanNigerianNorthern EuropeanNorwegianOkinawanOsageOttawaPaiutePakistaniPalestinianPanamanianParaguayanPennsylvania GermanPeruvianPimaPolishPortuguesePotawatomiPuebloPuerto RicanPuget Sound SalishRomanianRussianSalvadoranSamoanScandinavianScotch-IrishScottishSeminoleSenegaleseSerbianShoshoneSierra LeoneanSiouxSlavicSlovakSloveneSomaliSouth AfricanSouth AmericanSouth American IndianSoviet UnionSpaniardSpanishSpanish AmericanSpanish American IndianSri LankanSubsaharan AfricanSudaneseSwedishSwissSyrianTaiwaneseThaiTlingit-HaidaTohono O'OdhamTonganTrinidadian and TobagonianTsimshianTurkishU.S. Virgin IslanderUgandanUkrainianUruguayanUteVenezuelanVietnameseWelshWest IndianYakamaYaquiYugoslavianYumanYup'ikZimbabwean
Immigration
NonimmigrantsImmigrantsAfghanistanAfricaAlbaniaArgentinaArmeniaAsiaAustraliaAustriaBahamasBangladeshBarbadosBelarusBelgiumBelizeBoliviaBosnia and HerzegovinaBrazilBulgariaBurma/MyanmarCabo VerdeCambodiaCanadaCaribbeanCentral AmericaChileChinaColombiaCongoCosta RicaCroatiaCubaCzechoslovakiaDenmarkDominicaDominican RepublicEastern AfricaEastern AsiaEastern EuropeEcuadorEgyptEl SalvadorEnglandEritreaEthiopiaEuropeFijiFranceGermanyGhanaGreeceGrenadaGuatemalaGuyanaHaitiHondurasHong KongHungaryIndiaIndonesiaIranIraqIrelandIsraelItalyJamaicaJapanJordanKazakhstanKenyaKoreaKuwaitLaosLatin AmericaLatviaLebanonLiberiaLithuaniaMalaysiaMexicoMicronesiaMiddle AfricaMoldovaMoroccoNepalNetherlandsNicaraguaNigeriaNorth AmericaNorth MacedoniaNorthern AfricaNorthern EuropeNorwayOceaniaPakistanPanamaPeruPhilippinesPolandPortugalRomaniaRussiaSaudi ArabiaScotlandSenegalSerbiaSierra LeoneSingaporeSomaliaSouth AfricaSouth AmericaSouth Central AsiaSouth Eastern AsiaSouthern EuropeSpainSri LankaSt. Vincent and the GrenadinesSudanSwedenSwitzerlandSyriaTaiwanThailandTrinidad and TobagoTurkeyUgandaUkraineUruguayUzbekistanVenezuelaVietnamWest IndiesWestern AfricaWestern AsiaWestern EuropeYemenZaireZimbabweAzores
Wage/Income Gap
Income
Poverty
Unemployment
Labor Participation
Family Structure
Vehicle Availability
Education Level
Disability

Immigrants from Cameroon Wage/Income Gap
Exceptional

22.2%
WAGE/INCOME GAP
100.0/ 100
METRIC RATING
52nd/ 347
METRIC RANK

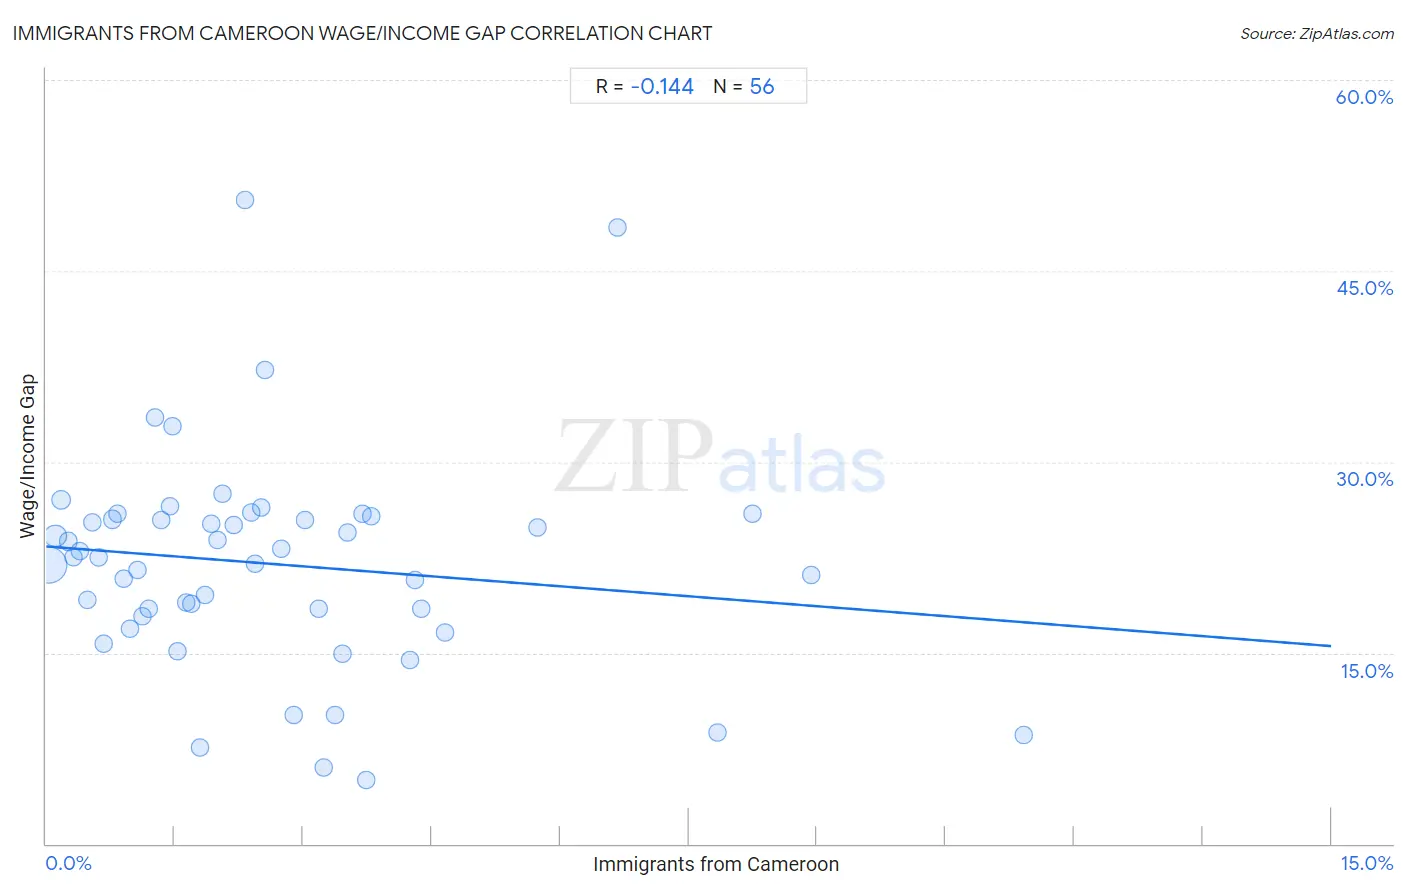
Immigrants from Cameroon Wage/Income Gap Correlation Chart

The statistical analysis conducted on geographies consisting of 130,750,722 people shows a poor negative correlation between the proportion of Immigrants from Cameroon and wage/income gap percentage in the United States with a correlation coefficient (R) of -0.144 and weighted average of 22.2%. On average, for every 1% (one percent) increase in Immigrants from Cameroon within a typical geography, there is a decrease of 0.52% in wage/income gap percentage.
Immigrants from Cameroon Wage/Income Gap
It is essential to understand that the correlation between the percentage of Immigrants from Cameroon and wage/income gap percentage does not imply a direct cause-and-effect relationship. It remains uncertain whether the presence of Immigrants from Cameroon influences an upward or downward trend in the level of wage/income gap percentage within an area, or if Immigrants from Cameroon simply ended up residing in those areas with higher or lower levels of wage/income gap percentage due to other factors.

Demographics Similar to Immigrants from Cameroon by Wage/Income Gap

In terms of wage/income gap, the demographic groups most similar to Immigrants from Cameroon are Bangladeshi (22.2%, a difference of 0.010%), Tohono O'odham (22.1%, a difference of 0.080%), Nepalese (22.2%, a difference of 0.24%), Immigrants from Western Africa (22.0%, a difference of 0.52%), and Immigrants from Zaire (22.3%, a difference of 0.64%).
DemographicsRating | RankWage/Income Gap
U.S. Virgin Islanders
100.0
/100
|
#45
Exceptional
21.5%
Immigrants from Ethiopia
100.0
/100
|
#46
Exceptional
21.6%
Immigrants from Congo
100.0
/100
|
#47
Exceptional
21.7%
Blacks/African Americans
100.0
/100
|
#48
Exceptional
21.7%
Ethiopians
100.0
/100
|
#49
Exceptional
21.8%
Immigrants from Western Africa
100.0
/100
|
#50
Exceptional
22.0%
Tohono O'odham
100.0
/100
|
#51
Exceptional
22.1%
Immigrants from Cameroon
100.0
/100
|
#52
Exceptional
22.2%
Bangladeshis
100.0
/100
|
#53
Exceptional
22.2%
Nepalese
100.0
/100
|
#54
Exceptional
22.2%
Immigrants from Zaire
100.0
/100
|
#55
Exceptional
22.3%
Immigrants from Ghana
100.0
/100
|
#56
Exceptional
22.3%
Ghanaians
100.0
/100
|
#57
Exceptional
22.3%
Immigrants from Cuba
100.0
/100
|
#58
Exceptional
22.4%
Navajo
100.0
/100
|
#59
Exceptional
22.4%

Immigrants from Cameroon Wage/Income Gap Correlation Summary

MeasurementImmigrants from Cameroon DataWage/Income Gap Data
Minimum0.024%5.0%
Maximum11.4%50.6%
Range11.4%45.7%
Mean2.6%22.0%
Median2.0%22.5%
Interquartile 25% (IQ1)1.0%18.2%
Interquartile 75% (IQ3)3.5%25.6%
Interquartile Range (IQR)2.5%7.5%
Standard Deviation (Sample)2.4%8.5%
Standard Deviation (Population)2.3%8.5%

Correlation Details

Immigrants from Cameroon PercentileSample SizeWage/Income Gap
[
0.0%
-
0.5%
]
0.024%
87,899,46221.9%
[
0.0%
-
0.5%
]
0.11%
20,479,23224.2%
[
0.0%
-
0.5%
]
0.18%
7,219,42827.0%
[
0.0%
-
0.5%
]
0.26%
4,081,87123.7%
[
0.0%
-
0.5%
]
0.32%
2,560,78522.5%
[
0.0%
-
0.5%
]
0.39%
1,400,08023.0%
[
0.0%
-
0.5%
]
0.48%
1,124,45919.2%
[
0.5%
-
1.0%
]
0.54%
1,372,62925.3%
[
0.5%
-
1.0%
]
0.61%
897,14122.5%
[
0.5%
-
1.0%
]
0.67%
468,87115.7%
[
0.5%
-
1.0%
]
0.77%
331,55025.5%
[
0.5%
-
1.0%
]
0.83%
382,00125.9%
[
0.5%
-
1.0%
]
0.90%
395,89520.8%
[
0.5%
-
1.0%
]
0.97%
245,38616.9%
[
1.0%
-
1.5%
]
1.06%
194,24621.5%
[
1.0%
-
1.5%
]
1.12%
112,39717.8%
[
1.0%
-
1.5%
]
1.19%
233,87318.5%
[
1.0%
-
1.5%
]
1.27%
55,52833.5%
[
1.0%
-
1.5%
]
1.34%
132,72125.5%
[
1.0%
-
1.5%
]
1.44%
73,43226.6%
[
1.0%
-
1.5%
]
1.47%
26,45332.8%
[
1.5%
-
2.0%
]
1.54%
17,31315.1%
[
1.5%
-
2.0%
]
1.63%
134,09418.9%
[
1.5%
-
2.0%
]
1.69%
58,83518.8%
[
1.5%
-
2.0%
]
1.79%
33,4767.6%
[
1.5%
-
2.0%
]
1.85%
156,98819.6%
[
1.5%
-
2.0%
]
1.93%
2,28125.1%
[
1.5%
-
2.0%
]
2.00%
59,37923.9%
[
2.0%
-
2.5%
]
2.05%
40,60727.5%
[
2.0%
-
2.5%
]
2.19%
6,34125.1%
[
2.0%
-
2.5%
]
2.31%
2,37650.6%
[
2.0%
-
2.5%
]
2.39%
33,42026.0%
[
2.0%
-
2.5%
]
2.44%
49,65822.0%
[
2.5%
-
3.0%
]
2.51%
2,03426.4%
[
2.5%
-
3.0%
]
2.55%
20,83337.2%
[
2.5%
-
3.0%
]
2.75%
3,89623.2%
[
2.5%
-
3.0%
]
2.89%
38,78210.1%
[
3.0%
-
3.5%
]
3.02%
12,10325.4%
[
3.0%
-
3.5%
]
3.18%
75,90118.5%
[
3.0%
-
3.5%
]
3.23%
58,0935.9%
[
3.0%
-
3.5%
]
3.37%
6,63810.2%
[
3.0%
-
3.5%
]
3.46%
11,66214.9%
[
3.5%
-
4.0%
]
3.52%
8,29024.5%
[
3.5%
-
4.0%
]
3.69%
2,33025.9%
[
3.5%
-
4.0%
]
3.73%
24,6465.0%
[
3.5%
-
4.0%
]
3.79%
12,12825.7%
[
4.0%
-
4.5%
]
4.24%
75,98814.4%
[
4.0%
-
4.5%
]
4.30%
28,42720.7%
[
4.0%
-
4.5%
]
4.38%
27,90918.5%
[
4.5%
-
5.0%
]
4.65%
16,94416.6%
[
5.5%
-
6.0%
]
5.73%
5,04124.8%
[
6.5%
-
7.0%
]
6.67%
2,69948.4%
[
7.5%
-
8.0%
]
7.84%
13,5808.7%
[
8.0%
-
8.5%
]
8.24%
15,48925.9%
[
8.5%
-
9.0%
]
8.92%
3,10421.1%
[
11.0%
-
11.5%
]
11.42%
1,9978.5%