Immigrants from Cameroon GED/Equivalency

COMPARE

Immigrants from Cameroon
Race
Ancestry
AfghanAfricanAlaska NativeAlaskan AthabascanAlbanianAleutAlsatianAmericanApacheArabArapahoArgentineanArmenianAssyrian/Chaldean/SyriacAustralianAustrianBahamianBangladeshiBarbadianBasqueBelgianBelizeanBermudanBhutaneseBlackfeetBolivianBrazilianBritishBritish West IndianBulgarianBurmeseCajunCambodianCanadianCape VerdeanCarpatho RusynCelticCentral AmericanCentral American IndianCherokeeCheyenneChickasawChileanChineseChippewaChoctawColombianColvilleComancheCosta RicanCreeCreekCroatianCrowCubanCypriotCzechCzechoslovakianDanishDelawareDominicanDutchDutch West IndianEastern EuropeanEcuadorianEgyptianEnglishEstonianEthiopianEuropeanFijianFilipinoFinnishFrenchFrench American IndianFrench CanadianGermanGerman RussianGhanaianGreekGuamanian/ChamorroGuatemalanGuyaneseHaitianHmongHonduranHopiHoumaHungarianIcelanderIndian (Asian)IndonesianInupiatIranianIraqiIrishIroquoisIsraeliItalianJamaicanJapaneseJordanianKenyanKiowaKoreanLaotianLatvianLebaneseLiberianLithuanianLumbeeLuxembourgerMacedonianMalaysianMalteseMarshalleseMenomineeMexicanMexican American IndianMongolianMoroccanNative HawaiianNavajoNepaleseNew ZealanderNicaraguanNigerianNorthern EuropeanNorwegianOkinawanOsageOttawaPaiutePakistaniPalestinianPanamanianParaguayanPennsylvania GermanPeruvianPimaPolishPortuguesePotawatomiPuebloPuerto RicanPuget Sound SalishRomanianRussianSalvadoranSamoanScandinavianScotch-IrishScottishSeminoleSenegaleseSerbianShoshoneSierra LeoneanSiouxSlavicSlovakSloveneSomaliSouth AfricanSouth AmericanSouth American IndianSoviet UnionSpaniardSpanishSpanish AmericanSpanish American IndianSri LankanSubsaharan AfricanSudaneseSwedishSwissSyrianTaiwaneseThaiTlingit-HaidaTohono O'OdhamTonganTrinidadian and TobagonianTsimshianTurkishU.S. Virgin IslanderUgandanUkrainianUruguayanUteVenezuelanVietnameseWelshWest IndianYakamaYaquiYugoslavianYumanYup'ikZimbabwean
Immigration
NonimmigrantsImmigrantsAfghanistanAfricaAlbaniaArgentinaArmeniaAsiaAustraliaAustriaBahamasBangladeshBarbadosBelarusBelgiumBelizeBoliviaBosnia and HerzegovinaBrazilBulgariaBurma/MyanmarCabo VerdeCambodiaCameroonCanadaCaribbeanCentral AmericaChileChinaColombiaCongoCosta RicaCroatiaCubaCzechoslovakiaDenmarkDominicaDominican RepublicEastern AfricaEastern AsiaEastern EuropeEcuadorEgyptEl SalvadorEnglandEritreaEthiopiaEuropeFijiFranceGermanyGhanaGreeceGrenadaGuatemalaGuyanaHaitiHondurasHong KongHungaryIndiaIndonesiaIranIraqIrelandIsraelItalyJamaicaJapanJordanKazakhstanKenyaKoreaKuwaitLaosLatin AmericaLatviaLebanonLiberiaLithuaniaMalaysiaMexicoMicronesiaMiddle AfricaMoldovaMoroccoNepalNetherlandsNicaraguaNigeriaNorth AmericaNorth MacedoniaNorthern AfricaNorthern EuropeNorwayOceaniaPakistanPanamaPeruPhilippinesPolandPortugalRomaniaRussiaSaudi ArabiaScotlandSenegalSerbiaSierra LeoneSingaporeSomaliaSouth AfricaSouth AmericaSouth Central AsiaSouth Eastern AsiaSouthern EuropeSpainSri LankaSt. Vincent and the GrenadinesSudanSwedenSwitzerlandSyriaTaiwanThailandTrinidad and TobagoTurkeyUgandaUkraineUruguayUzbekistanVenezuelaVietnamWest IndiesWestern AfricaWestern AsiaWestern EuropeYemenZaireZimbabweAzores
Select to Compare
Race
Ancestry
AfghanAfricanAlaska NativeAlaskan AthabascanAlbanianAleutAlsatianAmericanApacheArabArapahoArgentineanArmenianAssyrian/Chaldean/SyriacAustralianAustrianBahamianBangladeshiBarbadianBasqueBelgianBelizeanBermudanBhutaneseBlackfeetBolivianBrazilianBritishBritish West IndianBulgarianBurmeseCajunCambodianCanadianCape VerdeanCarpatho RusynCelticCentral AmericanCentral American IndianCherokeeCheyenneChickasawChileanChineseChippewaChoctawColombianColvilleComancheCosta RicanCreeCreekCroatianCrowCubanCypriotCzechCzechoslovakianDanishDelawareDominicanDutchDutch West IndianEastern EuropeanEcuadorianEgyptianEnglishEstonianEthiopianEuropeanFijianFilipinoFinnishFrenchFrench American IndianFrench CanadianGermanGerman RussianGhanaianGreekGuamanian/ChamorroGuatemalanGuyaneseHaitianHmongHonduranHopiHoumaHungarianIcelanderIndian (Asian)IndonesianInupiatIranianIraqiIrishIroquoisIsraeliItalianJamaicanJapaneseJordanianKenyanKiowaKoreanLaotianLatvianLebaneseLiberianLithuanianLumbeeLuxembourgerMacedonianMalaysianMalteseMarshalleseMenomineeMexicanMexican American IndianMongolianMoroccanNative HawaiianNavajoNepaleseNew ZealanderNicaraguanNigerianNorthern EuropeanNorwegianOkinawanOsageOttawaPaiutePakistaniPalestinianPanamanianParaguayanPennsylvania GermanPeruvianPimaPolishPortuguesePotawatomiPuebloPuerto RicanPuget Sound SalishRomanianRussianSalvadoranSamoanScandinavianScotch-IrishScottishSeminoleSenegaleseSerbianShoshoneSierra LeoneanSiouxSlavicSlovakSloveneSomaliSouth AfricanSouth AmericanSouth American IndianSoviet UnionSpaniardSpanishSpanish AmericanSpanish American IndianSri LankanSubsaharan AfricanSudaneseSwedishSwissSyrianTaiwaneseThaiTlingit-HaidaTohono O'OdhamTonganTrinidadian and TobagonianTsimshianTurkishU.S. Virgin IslanderUgandanUkrainianUruguayanUteVenezuelanVietnameseWelshWest IndianYakamaYaquiYugoslavianYumanYup'ikZimbabwean
Immigration
NonimmigrantsImmigrantsAfghanistanAfricaAlbaniaArgentinaArmeniaAsiaAustraliaAustriaBahamasBangladeshBarbadosBelarusBelgiumBelizeBoliviaBosnia and HerzegovinaBrazilBulgariaBurma/MyanmarCabo VerdeCambodiaCanadaCaribbeanCentral AmericaChileChinaColombiaCongoCosta RicaCroatiaCubaCzechoslovakiaDenmarkDominicaDominican RepublicEastern AfricaEastern AsiaEastern EuropeEcuadorEgyptEl SalvadorEnglandEritreaEthiopiaEuropeFijiFranceGermanyGhanaGreeceGrenadaGuatemalaGuyanaHaitiHondurasHong KongHungaryIndiaIndonesiaIranIraqIrelandIsraelItalyJamaicaJapanJordanKazakhstanKenyaKoreaKuwaitLaosLatin AmericaLatviaLebanonLiberiaLithuaniaMalaysiaMexicoMicronesiaMiddle AfricaMoldovaMoroccoNepalNetherlandsNicaraguaNigeriaNorth AmericaNorth MacedoniaNorthern AfricaNorthern EuropeNorwayOceaniaPakistanPanamaPeruPhilippinesPolandPortugalRomaniaRussiaSaudi ArabiaScotlandSenegalSerbiaSierra LeoneSingaporeSomaliaSouth AfricaSouth AmericaSouth Central AsiaSouth Eastern AsiaSouthern EuropeSpainSri LankaSt. Vincent and the GrenadinesSudanSwedenSwitzerlandSyriaTaiwanThailandTrinidad and TobagoTurkeyUgandaUkraineUruguayUzbekistanVenezuelaVietnamWest IndiesWestern AfricaWestern AsiaWestern EuropeYemenZaireZimbabweAzores
GED/Equivalency
Income
Poverty
Unemployment
Labor Participation
Family Structure
Vehicle Availability
Education Level
Disability

Immigrants from Cameroon GED/Equivalency
Poor

84.9%
GED/EQUIVALENCY
12.1/ 100
METRIC RATING
210th/ 347
METRIC RANK

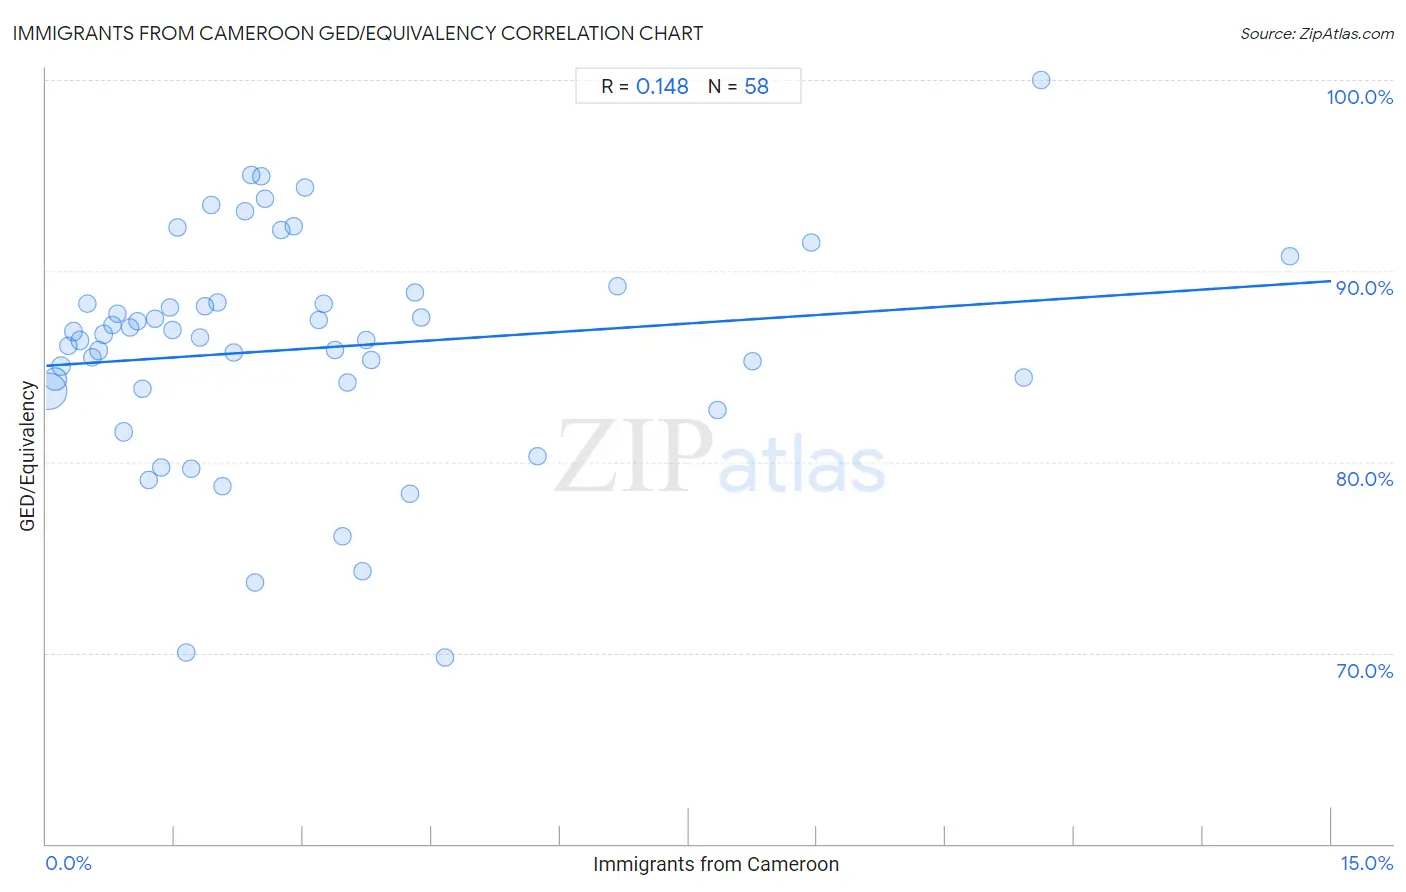
Immigrants from Cameroon GED/Equivalency Correlation Chart

The statistical analysis conducted on geographies consisting of 130,768,734 people shows a poor positive correlation between the proportion of Immigrants from Cameroon and percentage of population with at least ged/equivalency education in the United States with a correlation coefficient (R) of 0.148 and weighted average of 84.9%. On average, for every 1% (one percent) increase in Immigrants from Cameroon within a typical geography, there is an increase of 0.30% in percentage of population with at least ged/equivalency education.
Immigrants from Cameroon GED/Equivalency
It is essential to understand that the correlation between the percentage of Immigrants from Cameroon and percentage of population with at least ged/equivalency education does not imply a direct cause-and-effect relationship. It remains uncertain whether the presence of Immigrants from Cameroon influences an upward or downward trend in the level of percentage of population with at least ged/equivalency education within an area, or if Immigrants from Cameroon simply ended up residing in those areas with higher or lower levels of percentage of population with at least ged/equivalency education due to other factors.

Demographics Similar to Immigrants from Cameroon by GED/Equivalency

In terms of ged/equivalency, the demographic groups most similar to Immigrants from Cameroon are Colombian (84.9%, a difference of 0.010%), Marshallese (84.9%, a difference of 0.020%), Hmong (84.9%, a difference of 0.050%), South American (84.8%, a difference of 0.060%), and Samoan (84.9%, a difference of 0.070%).
DemographicsRating | RankGED/Equivalency
Panamanians
15.3
/100
|
#203
Poor
85.0%
Hawaiians
15.2
/100
|
#204
Poor
85.0%
Liberians
14.6
/100
|
#205
Poor
85.0%
Samoans
13.7
/100
|
#206
Poor
84.9%
Hmong
13.1
/100
|
#207
Poor
84.9%
Marshallese
12.5
/100
|
#208
Poor
84.9%
Colombians
12.3
/100
|
#209
Poor
84.9%
Immigrants from Cameroon
12.1
/100
|
#210
Poor
84.9%
South Americans
10.9
/100
|
#211
Poor
84.8%
Immigrants from Somalia
10.6
/100
|
#212
Poor
84.8%
Immigrants from Philippines
10.0
/100
|
#213
Poor
84.8%
Osage
9.5
/100
|
#214
Tragic
84.8%
Peruvians
9.2
/100
|
#215
Tragic
84.7%
Immigrants from Micronesia
8.7
/100
|
#216
Tragic
84.7%
Nigerians
8.6
/100
|
#217
Tragic
84.7%

Immigrants from Cameroon GED/Equivalency Correlation Summary

MeasurementImmigrants from Cameroon DataGED/Equivalency Data
Minimum0.024%69.8%
Maximum14.5%100.0%
Range14.5%30.2%
Mean3.0%85.9%
Median2.1%86.6%
Interquartile 25% (IQ1)1.1%83.8%
Interquartile 75% (IQ3)3.7%88.3%
Interquartile Range (IQR)2.6%4.5%
Standard Deviation (Sample)3.0%6.0%
Standard Deviation (Population)3.0%5.9%

Correlation Details

Immigrants from Cameroon PercentileSample SizeGED/Equivalency
[
0.0%
-
0.5%
]
0.024%
87,901,27283.7%
[
0.0%
-
0.5%
]
0.11%
20,479,23284.3%
[
0.0%
-
0.5%
]
0.18%
7,219,42885.0%
[
0.0%
-
0.5%
]
0.26%
4,090,21486.1%
[
0.0%
-
0.5%
]
0.32%
2,561,07186.8%
[
0.0%
-
0.5%
]
0.39%
1,400,08086.4%
[
0.0%
-
0.5%
]
0.48%
1,126,22388.3%
[
0.5%
-
1.0%
]
0.54%
1,375,06685.5%
[
0.5%
-
1.0%
]
0.61%
897,14185.8%
[
0.5%
-
1.0%
]
0.67%
468,87186.7%
[
0.5%
-
1.0%
]
0.77%
331,55087.2%
[
0.5%
-
1.0%
]
0.83%
382,00187.8%
[
0.5%
-
1.0%
]
0.90%
395,89581.6%
[
0.5%
-
1.0%
]
0.97%
246,27987.0%
[
1.0%
-
1.5%
]
1.06%
194,24687.4%
[
1.0%
-
1.5%
]
1.12%
113,21483.8%
[
1.0%
-
1.5%
]
1.19%
233,87379.0%
[
1.0%
-
1.5%
]
1.27%
55,52887.5%
[
1.0%
-
1.5%
]
1.34%
132,72179.7%
[
1.0%
-
1.5%
]
1.44%
73,43288.1%
[
1.0%
-
1.5%
]
1.47%
26,45386.9%
[
1.5%
-
2.0%
]
1.54%
17,31392.3%
[
1.5%
-
2.0%
]
1.63%
134,09470.0%
[
1.5%
-
2.0%
]
1.69%
58,83579.7%
[
1.5%
-
2.0%
]
1.79%
33,47686.5%
[
1.5%
-
2.0%
]
1.85%
156,98888.1%
[
1.5%
-
2.0%
]
1.93%
2,28193.4%
[
1.5%
-
2.0%
]
2.00%
59,37988.3%
[
2.0%
-
2.5%
]
2.05%
40,60778.7%
[
2.0%
-
2.5%
]
2.19%
6,34185.7%
[
2.0%
-
2.5%
]
2.31%
2,37693.1%
[
2.0%
-
2.5%
]
2.39%
33,42095.0%
[
2.0%
-
2.5%
]
2.44%
49,65873.7%
[
2.5%
-
3.0%
]
2.51%
2,03494.9%
[
2.5%
-
3.0%
]
2.55%
20,83393.8%
[
2.5%
-
3.0%
]
2.75%
3,89692.1%
[
2.5%
-
3.0%
]
2.89%
38,78292.4%
[
3.0%
-
3.5%
]
3.02%
12,10394.3%
[
3.0%
-
3.5%
]
3.18%
75,90187.4%
[
3.0%
-
3.5%
]
3.23%
58,09388.3%
[
3.0%
-
3.5%
]
3.37%
6,63885.8%
[
3.0%
-
3.5%
]
3.46%
11,66276.1%
[
3.5%
-
4.0%
]
3.52%
8,29084.1%
[
3.5%
-
4.0%
]
3.69%
2,33074.3%
[
3.5%
-
4.0%
]
3.73%
24,64686.4%
[
3.5%
-
4.0%
]
3.79%
12,12885.3%
[
4.0%
-
4.5%
]
4.24%
75,98878.4%
[
4.0%
-
4.5%
]
4.30%
28,42788.9%
[
4.0%
-
4.5%
]
4.38%
27,90987.6%
[
4.5%
-
5.0%
]
4.65%
16,94469.8%
[
5.5%
-
6.0%
]
5.73%
5,04180.3%
[
6.5%
-
7.0%
]
6.67%
2,69989.2%
[
7.5%
-
8.0%
]
7.84%
13,58082.7%
[
8.0%
-
8.5%
]
8.24%
15,48985.3%
[
8.5%
-
9.0%
]
8.92%
3,10491.5%
[
11.0%
-
11.5%
]
11.42%
1,99784.4%
[
11.5%
-
12.0%
]
11.61%
422100.0%
[
14.5%
-
15.0%
]
14.52%
1,24090.8%