Immigrants from Cameroon 3 or more Vehicles in Household
COMPARE
Immigrants from Cameroon
Select to Compare
3 or more Vehicles in Household
Immigrants from Cameroon 3 or more Vehicles in Household
19.7%
3+ VEHICLES AVAILABLE
60.9/ 100
METRIC RATING
166th/ 347
METRIC RANK
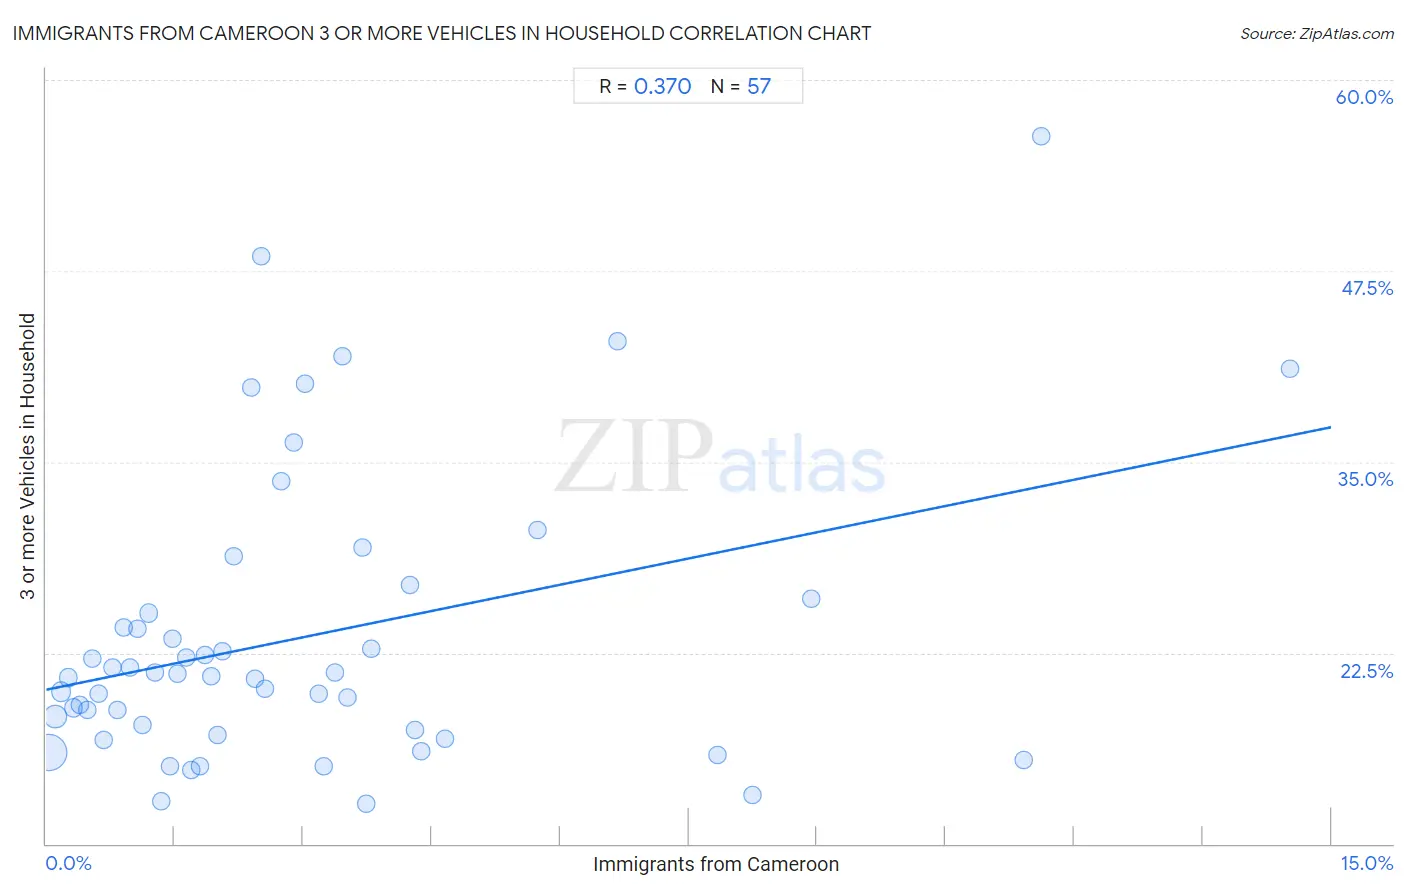
Immigrants from Cameroon 3 or more Vehicles in Household Correlation Chart
The statistical analysis conducted on geographies consisting of 130,731,455 people shows a mild positive correlation between the proportion of Immigrants from Cameroon and percentage of households with 3 or more vehicles available in the United States with a correlation coefficient (R) of 0.370 and weighted average of 19.7%. On average, for every 1% (one percent) increase in Immigrants from Cameroon within a typical geography, there is an increase of 1.1% in percentage of households with 3 or more vehicles available.
It is essential to understand that the correlation between the percentage of Immigrants from Cameroon and percentage of households with 3 or more vehicles available does not imply a direct cause-and-effect relationship. It remains uncertain whether the presence of Immigrants from Cameroon influences an upward or downward trend in the level of percentage of households with 3 or more vehicles available within an area, or if Immigrants from Cameroon simply ended up residing in those areas with higher or lower levels of percentage of households with 3 or more vehicles available due to other factors.
Demographics Similar to Immigrants from Cameroon by 3 or more Vehicles in Household
In terms of 3 or more vehicles in household, the demographic groups most similar to Immigrants from Cameroon are Immigrants from Costa Rica (19.7%, a difference of 0.080%), Yugoslavian (19.7%, a difference of 0.16%), Ukrainian (19.6%, a difference of 0.16%), Chilean (19.7%, a difference of 0.17%), and Peruvian (19.6%, a difference of 0.17%).
| Demographics | Rating | Rank | 3 or more Vehicles in Household |
| Immigrants from Pakistan | 68.2 /100 | #159 | Good 19.8% |
| Immigrants from Lebanon | 67.6 /100 | #160 | Good 19.8% |
| Immigrants from Guatemala | 65.6 /100 | #161 | Good 19.7% |
| Estonians | 63.2 /100 | #162 | Good 19.7% |
| Chileans | 63.0 /100 | #163 | Good 19.7% |
| Yugoslavians | 62.9 /100 | #164 | Good 19.7% |
| Immigrants from Costa Rica | 61.9 /100 | #165 | Good 19.7% |
| Immigrants from Cameroon | 60.9 /100 | #166 | Good 19.7% |
| Ukrainians | 58.9 /100 | #167 | Average 19.6% |
| Peruvians | 58.8 /100 | #168 | Average 19.6% |
| Immigrants from Denmark | 57.6 /100 | #169 | Average 19.6% |
| Iraqis | 56.0 /100 | #170 | Average 19.6% |
| Immigrants from Western Europe | 53.2 /100 | #171 | Average 19.5% |
| Kiowa | 50.9 /100 | #172 | Average 19.5% |
| Immigrants from Northern Europe | 50.2 /100 | #173 | Average 19.5% |
Immigrants from Cameroon 3 or more Vehicles in Household Correlation Summary
| Measurement | Immigrants from Cameroon Data | 3 or more Vehicles in Household Data |
| Minimum | 0.024% | 12.6% |
| Maximum | 14.5% | 56.3% |
| Range | 14.5% | 43.7% |
| Mean | 3.0% | 23.5% |
| Median | 2.1% | 20.9% |
| Interquartile 25% (IQ1) | 1.0% | 17.3% |
| Interquartile 75% (IQ3) | 3.7% | 25.6% |
| Interquartile Range (IQR) | 2.7% | 8.3% |
| Standard Deviation (Sample) | 3.0% | 9.4% |
| Standard Deviation (Population) | 3.0% | 9.3% |
Correlation Details
| Immigrants from Cameroon Percentile | Sample Size | 3 or more Vehicles in Household |
[ 0.0% - 0.5% ] 0.024% | 87,901,272 | 16.0% |
[ 0.0% - 0.5% ] 0.11% | 20,472,898 | 18.3% |
[ 0.0% - 0.5% ] 0.18% | 7,217,407 | 19.9% |
[ 0.0% - 0.5% ] 0.26% | 4,084,579 | 20.9% |
[ 0.0% - 0.5% ] 0.32% | 2,553,079 | 18.9% |
[ 0.0% - 0.5% ] 0.39% | 1,399,286 | 19.1% |
[ 0.0% - 0.5% ] 0.48% | 1,121,500 | 18.8% |
[ 0.5% - 1.0% ] 0.54% | 1,373,969 | 22.1% |
[ 0.5% - 1.0% ] 0.61% | 895,996 | 19.8% |
[ 0.5% - 1.0% ] 0.67% | 468,871 | 16.8% |
[ 0.5% - 1.0% ] 0.77% | 331,550 | 21.6% |
[ 0.5% - 1.0% ] 0.83% | 380,953 | 18.7% |
[ 0.5% - 1.0% ] 0.90% | 395,895 | 24.2% |
[ 0.5% - 1.0% ] 0.97% | 245,386 | 21.5% |
[ 1.0% - 1.5% ] 1.06% | 194,246 | 24.1% |
[ 1.0% - 1.5% ] 1.12% | 112,397 | 17.8% |
[ 1.0% - 1.5% ] 1.19% | 233,873 | 25.1% |
[ 1.0% - 1.5% ] 1.27% | 55,528 | 21.2% |
[ 1.0% - 1.5% ] 1.34% | 132,721 | 12.8% |
[ 1.0% - 1.5% ] 1.44% | 73,432 | 15.1% |
[ 1.0% - 1.5% ] 1.47% | 24,049 | 23.5% |
[ 1.5% - 2.0% ] 1.54% | 17,313 | 21.1% |
[ 1.5% - 2.0% ] 1.63% | 134,094 | 22.2% |
[ 1.5% - 2.0% ] 1.69% | 58,835 | 14.8% |
[ 1.5% - 2.0% ] 1.79% | 33,476 | 15.0% |
[ 1.5% - 2.0% ] 1.85% | 156,988 | 22.3% |
[ 1.5% - 2.0% ] 1.93% | 2,281 | 20.9% |
[ 1.5% - 2.0% ] 2.00% | 59,379 | 17.1% |
[ 2.0% - 2.5% ] 2.05% | 40,607 | 22.6% |
[ 2.0% - 2.5% ] 2.19% | 6,341 | 28.8% |
[ 2.0% - 2.5% ] 2.39% | 33,420 | 39.8% |
[ 2.0% - 2.5% ] 2.44% | 49,658 | 20.8% |
[ 2.5% - 3.0% ] 2.51% | 2,034 | 48.5% |
[ 2.5% - 3.0% ] 2.55% | 20,833 | 20.1% |
[ 2.5% - 3.0% ] 2.75% | 3,896 | 33.7% |
[ 2.5% - 3.0% ] 2.89% | 38,782 | 36.3% |
[ 3.0% - 3.5% ] 3.02% | 12,103 | 40.1% |
[ 3.0% - 3.5% ] 3.18% | 75,901 | 19.8% |
[ 3.0% - 3.5% ] 3.23% | 58,093 | 15.0% |
[ 3.0% - 3.5% ] 3.37% | 6,638 | 21.2% |
[ 3.0% - 3.5% ] 3.46% | 11,662 | 41.9% |
[ 3.5% - 4.0% ] 3.52% | 8,290 | 19.6% |
[ 3.5% - 4.0% ] 3.69% | 2,330 | 29.4% |
[ 3.5% - 4.0% ] 3.73% | 24,646 | 12.6% |
[ 3.5% - 4.0% ] 3.79% | 12,128 | 22.8% |
[ 4.0% - 4.5% ] 4.24% | 75,988 | 26.9% |
[ 4.0% - 4.5% ] 4.30% | 28,427 | 17.4% |
[ 4.0% - 4.5% ] 4.38% | 27,909 | 16.1% |
[ 4.5% - 5.0% ] 4.65% | 16,944 | 16.9% |
[ 5.5% - 6.0% ] 5.73% | 5,041 | 30.6% |
[ 6.5% - 7.0% ] 6.67% | 2,699 | 42.9% |
[ 7.5% - 8.0% ] 7.84% | 13,580 | 15.8% |
[ 8.0% - 8.5% ] 8.24% | 15,489 | 13.2% |
[ 8.5% - 9.0% ] 8.92% | 3,104 | 26.0% |
[ 11.0% - 11.5% ] 11.42% | 1,997 | 15.5% |
[ 11.5% - 12.0% ] 11.61% | 422 | 56.3% |
[ 14.5% - 15.0% ] 14.52% | 1,240 | 41.1% |