Immigrants from Asia Self-Care Disability
COMPARE
Immigrants from Asia
Select to Compare
Self-Care Disability
Immigrants from Asia Self-Care Disability
2.4%
SELF-CARE DISABILITY
96.9/ 100
METRIC RATING
95th/ 347
METRIC RANK
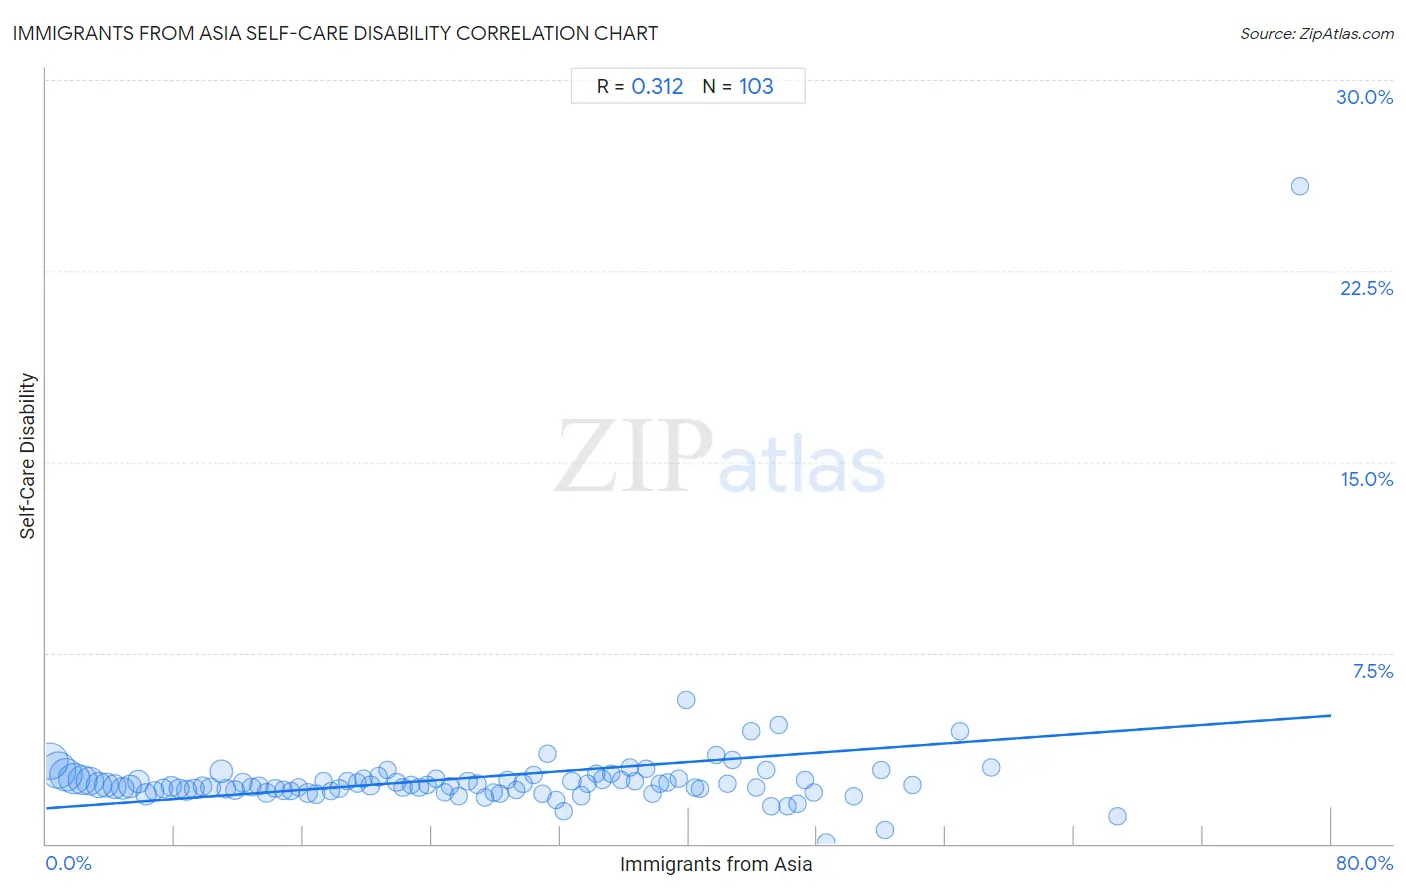
Immigrants from Asia Self-Care Disability Correlation Chart
The statistical analysis conducted on geographies consisting of 547,490,821 people shows a mild positive correlation between the proportion of Immigrants from Asia and percentage of population with self-care disability in the United States with a correlation coefficient (R) of 0.312 and weighted average of 2.4%. On average, for every 1% (one percent) increase in Immigrants from Asia within a typical geography, there is an increase of 0.046% in percentage of population with self-care disability.
It is essential to understand that the correlation between the percentage of Immigrants from Asia and percentage of population with self-care disability does not imply a direct cause-and-effect relationship. It remains uncertain whether the presence of Immigrants from Asia influences an upward or downward trend in the level of percentage of population with self-care disability within an area, or if Immigrants from Asia simply ended up residing in those areas with higher or lower levels of percentage of population with self-care disability due to other factors.
Demographics Similar to Immigrants from Asia by Self-Care Disability
In terms of self-care disability, the demographic groups most similar to Immigrants from Asia are Macedonian (2.4%, a difference of 0.010%), Immigrants from Latvia (2.4%, a difference of 0.050%), Immigrants from Chile (2.4%, a difference of 0.060%), Swiss (2.4%, a difference of 0.10%), and Immigrants from Poland (2.4%, a difference of 0.19%).
| Demographics | Rating | Rank | Self-Care Disability |
| Lithuanians | 98.0 /100 | #88 | Exceptional 2.4% |
| Immigrants from Congo | 98.0 /100 | #89 | Exceptional 2.4% |
| Immigrants from Czechoslovakia | 97.7 /100 | #90 | Exceptional 2.4% |
| Immigrants from Jordan | 97.7 /100 | #91 | Exceptional 2.4% |
| Icelanders | 97.4 /100 | #92 | Exceptional 2.4% |
| Immigrants from Latvia | 97.0 /100 | #93 | Exceptional 2.4% |
| Macedonians | 96.9 /100 | #94 | Exceptional 2.4% |
| Immigrants from Asia | 96.9 /100 | #95 | Exceptional 2.4% |
| Immigrants from Chile | 96.7 /100 | #96 | Exceptional 2.4% |
| Swiss | 96.6 /100 | #97 | Exceptional 2.4% |
| Immigrants from Poland | 96.4 /100 | #98 | Exceptional 2.4% |
| Immigrants from Israel | 96.1 /100 | #99 | Exceptional 2.4% |
| Europeans | 95.8 /100 | #100 | Exceptional 2.4% |
| Immigrants from Scotland | 95.7 /100 | #101 | Exceptional 2.4% |
| Croatians | 95.0 /100 | #102 | Exceptional 2.4% |
Immigrants from Asia Self-Care Disability Correlation Summary
| Measurement | Immigrants from Asia Data | Self-Care Disability Data |
| Minimum | 0.26% | 0.037% |
| Maximum | 78.1% | 25.8% |
| Range | 77.8% | 25.8% |
| Mean | 26.6% | 2.6% |
| Median | 25.7% | 2.3% |
| Interquartile 25% (IQ1) | 12.8% | 2.1% |
| Interquartile 75% (IQ3) | 38.6% | 2.5% |
| Interquartile Range (IQR) | 25.9% | 0.44% |
| Standard Deviation (Sample) | 16.5% | 2.4% |
| Standard Deviation (Population) | 16.5% | 2.4% |
Correlation Details
| Immigrants from Asia Percentile | Sample Size | Self-Care Disability |
[ 0.0% - 0.5% ] 0.26% | 65,427,833 | 3.2% |
[ 0.5% - 1.0% ] 0.74% | 64,504,734 | 2.9% |
[ 1.0% - 1.5% ] 1.24% | 54,004,785 | 2.7% |
[ 1.5% - 2.0% ] 1.74% | 44,886,168 | 2.6% |
[ 2.0% - 2.5% ] 2.24% | 38,722,055 | 2.5% |
[ 2.5% - 3.0% ] 2.73% | 35,993,830 | 2.5% |
[ 3.0% - 3.5% ] 3.23% | 26,074,833 | 2.3% |
[ 3.5% - 4.0% ] 3.75% | 21,221,661 | 2.3% |
[ 4.0% - 4.5% ] 4.25% | 19,071,788 | 2.2% |
[ 4.5% - 5.0% ] 4.75% | 15,673,225 | 2.2% |
[ 5.0% - 5.5% ] 5.24% | 16,263,566 | 2.2% |
[ 5.5% - 6.0% ] 5.74% | 15,542,614 | 2.4% |
[ 6.0% - 6.5% ] 6.25% | 9,501,906 | 1.9% |
[ 6.5% - 7.0% ] 6.75% | 6,865,643 | 2.1% |
[ 7.0% - 7.5% ] 7.29% | 6,911,122 | 2.2% |
[ 7.5% - 8.0% ] 7.77% | 7,397,533 | 2.3% |
[ 8.0% - 8.5% ] 8.27% | 5,871,252 | 2.2% |
[ 8.5% - 9.0% ] 8.73% | 6,584,955 | 2.1% |
[ 9.0% - 9.5% ] 9.22% | 4,799,238 | 2.1% |
[ 9.5% - 10.0% ] 9.74% | 4,407,020 | 2.2% |
[ 10.0% - 10.5% ] 10.23% | 4,472,894 | 2.2% |
[ 10.5% - 11.0% ] 10.88% | 16,869,561 | 2.8% |
[ 11.0% - 11.5% ] 11.23% | 4,172,814 | 2.2% |
[ 11.5% - 12.0% ] 11.76% | 4,082,737 | 2.1% |
[ 12.0% - 12.5% ] 12.22% | 2,403,473 | 2.4% |
[ 12.5% - 13.0% ] 12.78% | 2,625,034 | 2.2% |
[ 13.0% - 13.5% ] 13.24% | 2,255,881 | 2.3% |
[ 13.5% - 14.0% ] 13.73% | 2,007,311 | 2.0% |
[ 14.0% - 14.5% ] 14.24% | 2,626,390 | 2.2% |
[ 14.5% - 15.0% ] 14.76% | 1,837,515 | 2.1% |
[ 15.0% - 15.5% ] 15.26% | 1,758,276 | 2.1% |
[ 15.5% - 16.0% ] 15.71% | 1,135,754 | 2.2% |
[ 16.0% - 16.5% ] 16.29% | 1,294,051 | 2.0% |
[ 16.5% - 17.0% ] 16.81% | 1,423,054 | 2.0% |
[ 17.0% - 17.5% ] 17.27% | 1,333,341 | 2.5% |
[ 17.5% - 18.0% ] 17.74% | 1,560,746 | 2.1% |
[ 18.0% - 18.5% ] 18.24% | 1,622,998 | 2.2% |
[ 18.5% - 19.0% ] 18.74% | 1,374,172 | 2.5% |
[ 19.0% - 19.5% ] 19.34% | 937,162 | 2.4% |
[ 19.5% - 20.0% ] 19.73% | 864,060 | 2.5% |
[ 20.0% - 20.5% ] 20.19% | 1,264,784 | 2.3% |
[ 20.5% - 21.0% ] 20.71% | 1,289,285 | 2.6% |
[ 21.0% - 21.5% ] 21.27% | 610,995 | 2.9% |
[ 21.5% - 22.0% ] 21.80% | 1,625,216 | 2.4% |
[ 22.0% - 22.5% ] 22.21% | 591,994 | 2.2% |
[ 22.5% - 23.0% ] 22.75% | 737,193 | 2.3% |
[ 23.0% - 23.5% ] 23.23% | 653,987 | 2.2% |
[ 23.5% - 24.0% ] 23.75% | 695,257 | 2.3% |
[ 24.0% - 24.5% ] 24.26% | 718,694 | 2.6% |
[ 24.5% - 25.0% ] 24.79% | 920,581 | 2.0% |
[ 25.0% - 25.5% ] 25.17% | 150,886 | 2.2% |
[ 25.5% - 26.0% ] 25.71% | 687,396 | 1.9% |
[ 26.0% - 26.5% ] 26.26% | 452,963 | 2.4% |
[ 26.5% - 27.0% ] 26.83% | 1,266,078 | 2.3% |
[ 27.0% - 27.5% ] 27.30% | 477,891 | 1.8% |
[ 27.5% - 28.0% ] 27.83% | 85,952 | 2.0% |
[ 28.0% - 28.5% ] 28.22% | 539,653 | 2.0% |
[ 28.5% - 29.0% ] 28.72% | 261,052 | 2.5% |
[ 29.0% - 29.5% ] 29.28% | 368,007 | 2.1% |
[ 29.5% - 30.0% ] 29.68% | 710,826 | 2.4% |
[ 30.0% - 30.5% ] 30.34% | 317,728 | 2.7% |
[ 30.5% - 31.0% ] 30.88% | 308,289 | 1.9% |
[ 31.0% - 31.5% ] 31.22% | 171,675 | 3.6% |
[ 31.5% - 32.0% ] 31.71% | 488,412 | 1.7% |
[ 32.0% - 32.5% ] 32.24% | 125,570 | 1.3% |
[ 32.5% - 33.0% ] 32.72% | 251,166 | 2.5% |
[ 33.0% - 33.5% ] 33.34% | 224,710 | 1.9% |
[ 33.5% - 34.0% ] 33.72% | 149,691 | 2.4% |
[ 34.0% - 34.5% ] 34.20% | 171,820 | 2.7% |
[ 34.5% - 35.0% ] 34.66% | 356,115 | 2.5% |
[ 35.0% - 35.5% ] 35.17% | 171,322 | 2.7% |
[ 35.5% - 36.0% ] 35.77% | 187,743 | 2.5% |
[ 36.0% - 36.5% ] 36.31% | 306,683 | 3.0% |
[ 36.5% - 37.0% ] 36.62% | 231,065 | 2.5% |
[ 37.0% - 37.5% ] 37.34% | 70,484 | 3.0% |
[ 37.5% - 38.0% ] 37.78% | 99,529 | 1.9% |
[ 38.0% - 38.5% ] 38.20% | 328,554 | 2.4% |
[ 38.5% - 39.0% ] 38.64% | 503,242 | 2.4% |
[ 39.0% - 39.5% ] 39.36% | 225,798 | 2.5% |
[ 39.5% - 40.0% ] 39.87% | 276,472 | 5.7% |
[ 40.0% - 40.5% ] 40.36% | 66,844 | 2.2% |
[ 40.5% - 41.0% ] 40.69% | 109,337 | 2.2% |
[ 41.5% - 42.0% ] 41.74% | 63,360 | 3.5% |
[ 42.0% - 42.5% ] 42.38% | 339,136 | 2.4% |
[ 42.5% - 43.0% ] 42.74% | 173,120 | 3.3% |
[ 43.5% - 44.0% ] 43.89% | 139,016 | 4.4% |
[ 44.0% - 44.5% ] 44.23% | 140,768 | 2.2% |
[ 44.5% - 45.0% ] 44.79% | 127,809 | 2.9% |
[ 45.0% - 45.5% ] 45.11% | 21,250 | 1.5% |
[ 45.5% - 46.0% ] 45.62% | 63,812 | 4.7% |
[ 46.0% - 46.5% ] 46.17% | 40,462 | 1.5% |
[ 46.5% - 47.0% ] 46.76% | 53,256 | 1.6% |
[ 47.0% - 47.5% ] 47.26% | 109,289 | 2.5% |
[ 47.5% - 48.0% ] 47.75% | 319,459 | 2.0% |
[ 48.5% - 49.0% ] 48.54% | 14,371 | 0.037% |
[ 50.0% - 50.5% ] 50.31% | 57,649 | 1.9% |
[ 51.5% - 52.0% ] 51.97% | 26,418 | 2.9% |
[ 52.0% - 52.5% ] 52.22% | 30,916 | 0.54% |
[ 53.5% - 54.0% ] 53.91% | 53,371 | 2.3% |
[ 56.5% - 57.0% ] 56.92% | 766 | 4.4% |
[ 58.5% - 59.0% ] 58.82% | 79,495 | 3.0% |
[ 66.5% - 67.0% ] 66.69% | 2,996 | 1.1% |
[ 78.0% - 78.5% ] 78.09% | 178 | 25.8% |