Immigrants from Asia 4 or more Vehicles in Household
COMPARE
Immigrants from Asia
Select to Compare
4 or more Vehicles in Household
Immigrants from Asia 4 or more Vehicles in Household
6.8%
4+ VEHICLES AVAILABLE
94.4/ 100
METRIC RATING
124th/ 347
METRIC RANK
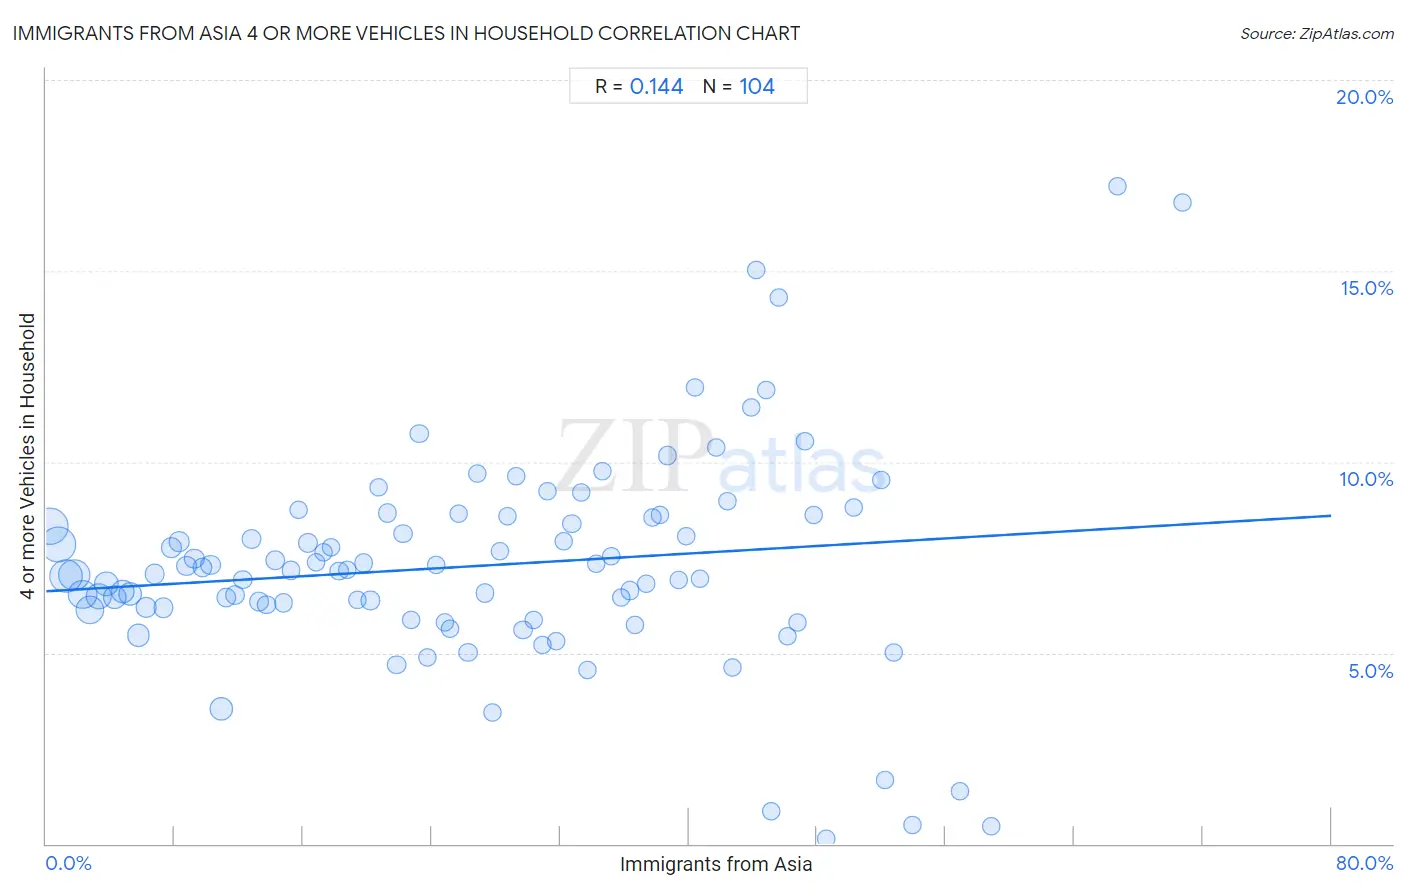
Immigrants from Asia 4 or more Vehicles in Household Correlation Chart
The statistical analysis conducted on geographies consisting of 545,943,212 people shows a poor positive correlation between the proportion of Immigrants from Asia and percentage of households with 4 or more vehicles available in the United States with a correlation coefficient (R) of 0.144 and weighted average of 6.8%. On average, for every 1% (one percent) increase in Immigrants from Asia within a typical geography, there is an increase of 0.025% in percentage of households with 4 or more vehicles available.
It is essential to understand that the correlation between the percentage of Immigrants from Asia and percentage of households with 4 or more vehicles available does not imply a direct cause-and-effect relationship. It remains uncertain whether the presence of Immigrants from Asia influences an upward or downward trend in the level of percentage of households with 4 or more vehicles available within an area, or if Immigrants from Asia simply ended up residing in those areas with higher or lower levels of percentage of households with 4 or more vehicles available due to other factors.
Demographics Similar to Immigrants from Asia by 4 or more Vehicles in Household
In terms of 4 or more vehicles in household, the demographic groups most similar to Immigrants from Asia are Immigrants (6.8%, a difference of 0.10%), Austrian (6.8%, a difference of 0.10%), Belgian (6.8%, a difference of 0.10%), Immigrants from Germany (6.8%, a difference of 0.16%), and Immigrants from Nicaragua (6.8%, a difference of 0.16%).
| Demographics | Rating | Rank | 4 or more Vehicles in Household |
| Burmese | 95.7 /100 | #117 | Exceptional 6.8% |
| French American Indians | 95.7 /100 | #118 | Exceptional 6.8% |
| Costa Ricans | 95.5 /100 | #119 | Exceptional 6.8% |
| Comanche | 94.8 /100 | #120 | Exceptional 6.8% |
| Immigrants from Germany | 94.7 /100 | #121 | Exceptional 6.8% |
| Immigrants from Nicaragua | 94.7 /100 | #122 | Exceptional 6.8% |
| Immigrants | 94.6 /100 | #123 | Exceptional 6.8% |
| Immigrants from Asia | 94.4 /100 | #124 | Exceptional 6.8% |
| Austrians | 94.1 /100 | #125 | Exceptional 6.8% |
| Belgians | 94.1 /100 | #126 | Exceptional 6.8% |
| Immigrants from Korea | 93.8 /100 | #127 | Exceptional 6.8% |
| Immigrants from Bolivia | 92.5 /100 | #128 | Exceptional 6.7% |
| Immigrants from England | 92.0 /100 | #129 | Exceptional 6.7% |
| Immigrants from Scotland | 89.0 /100 | #130 | Excellent 6.7% |
| Maltese | 88.4 /100 | #131 | Excellent 6.7% |
Immigrants from Asia 4 or more Vehicles in Household Correlation Summary
| Measurement | Immigrants from Asia Data | 4 or more Vehicles in Household Data |
| Minimum | 0.26% | 0.13% |
| Maximum | 70.7% | 17.2% |
| Range | 70.5% | 17.1% |
| Mean | 26.8% | 7.3% |
| Median | 26.0% | 7.2% |
| Interquartile 25% (IQ1) | 13.0% | 6.2% |
| Interquartile 75% (IQ3) | 39.0% | 8.6% |
| Interquartile Range (IQR) | 26.0% | 2.4% |
| Standard Deviation (Sample) | 16.4% | 2.8% |
| Standard Deviation (Population) | 16.4% | 2.8% |
Correlation Details
| Immigrants from Asia Percentile | Sample Size | 4 or more Vehicles in Household |
[ 0.0% - 0.5% ] 0.26% | 65,431,401 | 8.3% |
[ 0.5% - 1.0% ] 0.74% | 64,561,690 | 7.8% |
[ 1.0% - 1.5% ] 1.24% | 53,919,810 | 7.0% |
[ 1.5% - 2.0% ] 1.74% | 44,749,743 | 7.0% |
[ 2.0% - 2.5% ] 2.24% | 38,640,964 | 6.5% |
[ 2.5% - 3.0% ] 2.73% | 35,895,033 | 6.1% |
[ 3.0% - 3.5% ] 3.23% | 26,024,786 | 6.5% |
[ 3.5% - 4.0% ] 3.75% | 21,066,890 | 6.8% |
[ 4.0% - 4.5% ] 4.25% | 19,040,471 | 6.5% |
[ 4.5% - 5.0% ] 4.75% | 15,464,469 | 6.6% |
[ 5.0% - 5.5% ] 5.24% | 16,255,213 | 6.5% |
[ 5.5% - 6.0% ] 5.74% | 15,470,914 | 5.5% |
[ 6.0% - 6.5% ] 6.25% | 9,429,292 | 6.2% |
[ 6.5% - 7.0% ] 6.75% | 6,843,910 | 7.1% |
[ 7.0% - 7.5% ] 7.29% | 6,901,447 | 6.2% |
[ 7.5% - 8.0% ] 7.77% | 7,366,480 | 7.8% |
[ 8.0% - 8.5% ] 8.27% | 5,863,458 | 7.9% |
[ 8.5% - 9.0% ] 8.73% | 6,575,511 | 7.3% |
[ 9.0% - 9.5% ] 9.22% | 4,781,598 | 7.5% |
[ 9.5% - 10.0% ] 9.74% | 4,372,545 | 7.2% |
[ 10.0% - 10.5% ] 10.23% | 4,460,914 | 7.3% |
[ 10.5% - 11.0% ] 10.88% | 16,854,027 | 3.5% |
[ 11.0% - 11.5% ] 11.23% | 4,169,765 | 6.4% |
[ 11.5% - 12.0% ] 11.76% | 4,081,387 | 6.5% |
[ 12.0% - 12.5% ] 12.22% | 2,349,915 | 6.9% |
[ 12.5% - 13.0% ] 12.78% | 2,568,881 | 8.0% |
[ 13.0% - 13.5% ] 13.24% | 2,223,808 | 6.3% |
[ 13.5% - 14.0% ] 13.73% | 2,003,585 | 6.3% |
[ 14.0% - 14.5% ] 14.24% | 2,602,699 | 7.4% |
[ 14.5% - 15.0% ] 14.76% | 1,828,084 | 6.3% |
[ 15.0% - 15.5% ] 15.26% | 1,737,533 | 7.2% |
[ 15.5% - 16.0% ] 15.71% | 1,098,665 | 8.7% |
[ 16.0% - 16.5% ] 16.29% | 1,294,752 | 7.9% |
[ 16.5% - 17.0% ] 16.81% | 1,422,247 | 7.4% |
[ 17.0% - 17.5% ] 17.27% | 1,334,509 | 7.6% |
[ 17.5% - 18.0% ] 17.74% | 1,538,084 | 7.8% |
[ 18.0% - 18.5% ] 18.24% | 1,626,677 | 7.1% |
[ 18.5% - 19.0% ] 18.74% | 1,367,472 | 7.2% |
[ 19.0% - 19.5% ] 19.34% | 934,796 | 6.4% |
[ 19.5% - 20.0% ] 19.73% | 853,566 | 7.4% |
[ 20.0% - 20.5% ] 20.19% | 1,239,122 | 6.4% |
[ 20.5% - 21.0% ] 20.71% | 1,289,299 | 9.3% |
[ 21.0% - 21.5% ] 21.27% | 603,153 | 8.7% |
[ 21.5% - 22.0% ] 21.80% | 1,623,157 | 4.7% |
[ 22.0% - 22.5% ] 22.21% | 592,398 | 8.1% |
[ 22.5% - 23.0% ] 22.74% | 678,448 | 5.9% |
[ 23.0% - 23.5% ] 23.23% | 643,154 | 10.7% |
[ 23.5% - 24.0% ] 23.75% | 695,257 | 4.9% |
[ 24.0% - 24.5% ] 24.26% | 710,655 | 7.3% |
[ 24.5% - 25.0% ] 24.79% | 920,577 | 5.8% |
[ 25.0% - 25.5% ] 25.17% | 150,886 | 5.6% |
[ 25.5% - 26.0% ] 25.70% | 685,092 | 8.7% |
[ 26.0% - 26.5% ] 26.26% | 453,247 | 5.0% |
[ 26.5% - 27.0% ] 26.83% | 1,263,934 | 9.7% |
[ 27.0% - 27.5% ] 27.31% | 467,686 | 6.6% |
[ 27.5% - 28.0% ] 27.81% | 75,126 | 3.4% |
[ 28.0% - 28.5% ] 28.21% | 519,780 | 7.6% |
[ 28.5% - 29.0% ] 28.72% | 260,684 | 8.6% |
[ 29.0% - 29.5% ] 29.28% | 368,007 | 9.6% |
[ 29.5% - 30.0% ] 29.68% | 710,826 | 5.6% |
[ 30.0% - 30.5% ] 30.34% | 317,791 | 5.8% |
[ 30.5% - 31.0% ] 30.88% | 308,289 | 5.2% |
[ 31.0% - 31.5% ] 31.22% | 171,675 | 9.2% |
[ 31.5% - 32.0% ] 31.71% | 488,080 | 5.3% |
[ 32.0% - 32.5% ] 32.23% | 121,096 | 7.9% |
[ 32.5% - 33.0% ] 32.72% | 251,166 | 8.4% |
[ 33.0% - 33.5% ] 33.34% | 221,944 | 9.2% |
[ 33.5% - 34.0% ] 33.72% | 149,691 | 4.5% |
[ 34.0% - 34.5% ] 34.20% | 171,820 | 7.3% |
[ 34.5% - 35.0% ] 34.66% | 356,115 | 9.8% |
[ 35.0% - 35.5% ] 35.17% | 171,322 | 7.5% |
[ 35.5% - 36.0% ] 35.77% | 191,381 | 6.5% |
[ 36.0% - 36.5% ] 36.31% | 304,548 | 6.6% |
[ 36.5% - 37.0% ] 36.62% | 222,648 | 5.7% |
[ 37.0% - 37.5% ] 37.34% | 70,484 | 6.8% |
[ 37.5% - 38.0% ] 37.78% | 99,712 | 8.5% |
[ 38.0% - 38.5% ] 38.20% | 328,554 | 8.6% |
[ 38.5% - 39.0% ] 38.64% | 503,242 | 10.2% |
[ 39.0% - 39.5% ] 39.36% | 225,798 | 6.9% |
[ 39.5% - 40.0% ] 39.87% | 276,472 | 8.1% |
[ 40.0% - 40.5% ] 40.37% | 64,284 | 11.9% |
[ 40.5% - 41.0% ] 40.69% | 109,337 | 6.9% |
[ 41.5% - 42.0% ] 41.74% | 63,360 | 10.4% |
[ 42.0% - 42.5% ] 42.38% | 341,806 | 9.0% |
[ 42.5% - 43.0% ] 42.74% | 173,120 | 4.6% |
[ 43.5% - 44.0% ] 43.89% | 139,016 | 11.4% |
[ 44.0% - 44.5% ] 44.23% | 139,629 | 15.0% |
[ 44.5% - 45.0% ] 44.79% | 127,809 | 11.9% |
[ 45.0% - 45.5% ] 45.10% | 20,693 | 0.86% |
[ 45.5% - 46.0% ] 45.62% | 63,812 | 14.3% |
[ 46.0% - 46.5% ] 46.17% | 40,462 | 5.4% |
[ 46.5% - 47.0% ] 46.76% | 53,256 | 5.8% |
[ 47.0% - 47.5% ] 47.26% | 109,289 | 10.5% |
[ 47.5% - 48.0% ] 47.75% | 321,759 | 8.6% |
[ 48.5% - 49.0% ] 48.54% | 14,371 | 0.13% |
[ 50.0% - 50.5% ] 50.31% | 57,649 | 8.8% |
[ 51.5% - 52.0% ] 51.97% | 26,418 | 9.5% |
[ 52.0% - 52.5% ] 52.22% | 30,916 | 1.7% |
[ 52.5% - 53.0% ] 52.78% | 144 | 5.0% |
[ 53.5% - 54.0% ] 53.91% | 53,371 | 0.50% |
[ 56.5% - 57.0% ] 56.92% | 766 | 1.4% |
[ 58.5% - 59.0% ] 58.82% | 79,495 | 0.45% |
[ 66.5% - 67.0% ] 66.69% | 2,996 | 17.2% |
[ 70.5% - 71.0% ] 70.75% | 147 | 16.8% |