Immigrants from Asia Wage/Income Gap
COMPARE
Immigrants from Asia
Select to Compare
Wage/Income Gap
Immigrants from Asia Wage/Income Gap
27.0%
WAGE/INCOME GAP
5.5/ 100
METRIC RATING
229th/ 347
METRIC RANK
Immigrants from Asia Wage/Income Gap Correlation Chart
The statistical analysis conducted on geographies consisting of 547,716,290 people shows a slight positive correlation between the proportion of Immigrants from Asia and wage/income gap percentage in the United States with a correlation coefficient (R) of 0.051 and weighted average of 27.0%. On average, for every 1% (one percent) increase in Immigrants from Asia within a typical geography, there is an increase of 0.020% in wage/income gap percentage.
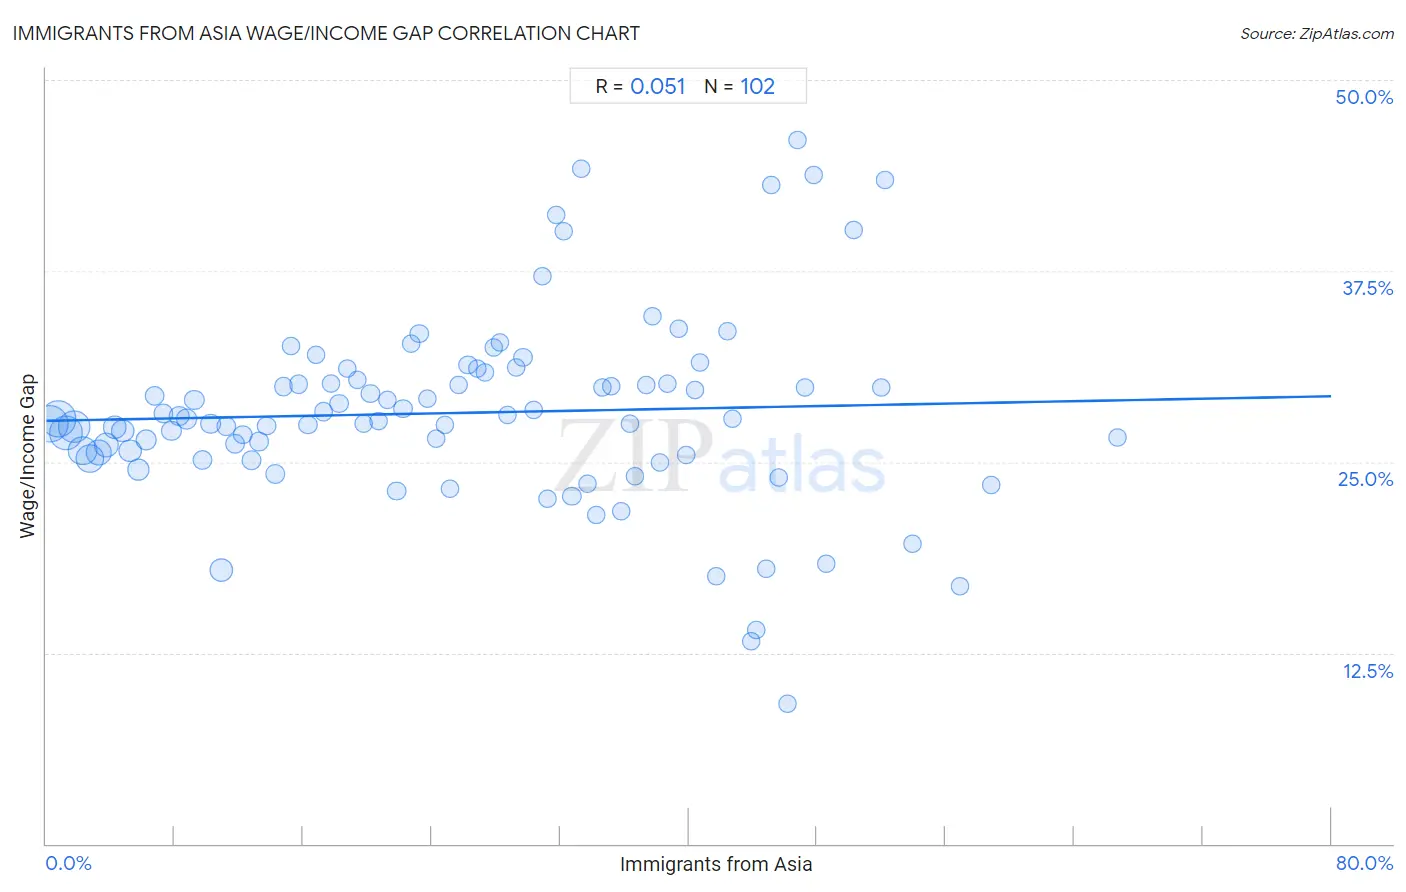
It is essential to understand that the correlation between the percentage of Immigrants from Asia and wage/income gap percentage does not imply a direct cause-and-effect relationship. It remains uncertain whether the presence of Immigrants from Asia influences an upward or downward trend in the level of wage/income gap percentage within an area, or if Immigrants from Asia simply ended up residing in those areas with higher or lower levels of wage/income gap percentage due to other factors.
Demographics Similar to Immigrants from Asia by Wage/Income Gap
In terms of wage/income gap, the demographic groups most similar to Immigrants from Asia are Immigrants from Turkey (27.0%, a difference of 0.030%), Spaniard (27.0%, a difference of 0.040%), Ottawa (27.0%, a difference of 0.050%), Bhutanese (27.0%, a difference of 0.070%), and Argentinean (27.0%, a difference of 0.10%).
| Demographics | Rating | Rank | Wage/Income Gap |
| Bolivians | 8.3 /100 | #222 | Tragic 26.8% |
| Jordanians | 8.0 /100 | #223 | Tragic 26.8% |
| Immigrants from Argentina | 7.2 /100 | #224 | Tragic 26.8% |
| Immigrants from Ireland | 6.5 /100 | #225 | Tragic 26.9% |
| Asians | 5.9 /100 | #226 | Tragic 26.9% |
| Spaniards | 5.6 /100 | #227 | Tragic 27.0% |
| Immigrants from Turkey | 5.6 /100 | #228 | Tragic 27.0% |
| Immigrants from Asia | 5.5 /100 | #229 | Tragic 27.0% |
| Ottawa | 5.3 /100 | #230 | Tragic 27.0% |
| Bhutanese | 5.3 /100 | #231 | Tragic 27.0% |
| Argentineans | 5.2 /100 | #232 | Tragic 27.0% |
| Immigrants from Brazil | 5.0 /100 | #233 | Tragic 27.0% |
| Immigrants from Pakistan | 4.9 /100 | #234 | Tragic 27.0% |
| Immigrants from Hungary | 4.8 /100 | #235 | Tragic 27.0% |
| Immigrants from Romania | 4.8 /100 | #236 | Tragic 27.0% |
Immigrants from Asia Wage/Income Gap Correlation Summary
| Measurement | Immigrants from Asia Data | Wage/Income Gap Data |
| Minimum | 0.26% | 9.2% |
| Maximum | 66.7% | 46.1% |
| Range | 66.4% | 36.9% |
| Mean | 26.1% | 28.2% |
| Median | 25.4% | 27.8% |
| Interquartile 25% (IQ1) | 12.8% | 25.4% |
| Interquartile 75% (IQ3) | 38.2% | 30.4% |
| Interquartile Range (IQR) | 25.4% | 4.9% |
| Standard Deviation (Sample) | 15.8% | 6.3% |
| Standard Deviation (Population) | 15.7% | 6.2% |
Correlation Details
| Immigrants from Asia Percentile | Sample Size | Wage/Income Gap |
[ 0.0% - 0.5% ] 0.26% | 65,270,173 | 27.5% |
[ 0.5% - 1.0% ] 0.74% | 64,460,152 | 27.8% |
[ 1.0% - 1.5% ] 1.24% | 54,020,661 | 26.9% |
[ 1.5% - 2.0% ] 1.74% | 44,929,367 | 27.3% |
[ 2.0% - 2.5% ] 2.24% | 38,762,470 | 25.7% |
[ 2.5% - 3.0% ] 2.73% | 36,010,200 | 25.2% |
[ 3.0% - 3.5% ] 3.23% | 26,123,809 | 25.6% |
[ 3.5% - 4.0% ] 3.75% | 21,234,928 | 26.1% |
[ 4.0% - 4.5% ] 4.25% | 19,122,346 | 27.3% |
[ 4.5% - 5.0% ] 4.75% | 15,664,660 | 27.0% |
[ 5.0% - 5.5% ] 5.24% | 16,281,526 | 25.7% |
[ 5.5% - 6.0% ] 5.74% | 15,556,668 | 24.5% |
[ 6.0% - 6.5% ] 6.25% | 9,507,264 | 26.4% |
[ 6.5% - 7.0% ] 6.75% | 6,879,705 | 29.3% |
[ 7.0% - 7.5% ] 7.29% | 6,930,159 | 28.2% |
[ 7.5% - 8.0% ] 7.77% | 7,407,648 | 27.0% |
[ 8.0% - 8.5% ] 8.27% | 5,880,534 | 28.0% |
[ 8.5% - 9.0% ] 8.73% | 6,592,772 | 27.8% |
[ 9.0% - 9.5% ] 9.22% | 4,810,072 | 29.1% |
[ 9.5% - 10.0% ] 9.74% | 4,423,734 | 25.2% |
[ 10.0% - 10.5% ] 10.23% | 4,465,046 | 27.5% |
[ 10.5% - 11.0% ] 10.88% | 16,899,990 | 17.9% |
[ 11.0% - 11.5% ] 11.23% | 4,175,375 | 27.4% |
[ 11.5% - 12.0% ] 11.76% | 4,082,575 | 26.2% |
[ 12.0% - 12.5% ] 12.22% | 2,414,745 | 26.8% |
[ 12.5% - 13.0% ] 12.78% | 2,622,060 | 25.1% |
[ 13.0% - 13.5% ] 13.24% | 2,259,660 | 26.3% |
[ 13.5% - 14.0% ] 13.73% | 2,008,311 | 27.4% |
[ 14.0% - 14.5% ] 14.24% | 2,626,078 | 24.2% |
[ 14.5% - 15.0% ] 14.76% | 1,835,006 | 29.9% |
[ 15.0% - 15.5% ] 15.26% | 1,757,645 | 32.6% |
[ 15.5% - 16.0% ] 15.71% | 1,137,987 | 30.1% |
[ 16.0% - 16.5% ] 16.29% | 1,305,073 | 27.4% |
[ 16.5% - 17.0% ] 16.81% | 1,426,347 | 32.0% |
[ 17.0% - 17.5% ] 17.27% | 1,336,045 | 28.3% |
[ 17.5% - 18.0% ] 17.74% | 1,569,045 | 30.1% |
[ 18.0% - 18.5% ] 18.24% | 1,627,554 | 28.8% |
[ 18.5% - 19.0% ] 18.74% | 1,374,172 | 31.1% |
[ 19.0% - 19.5% ] 19.34% | 938,984 | 30.4% |
[ 19.5% - 20.0% ] 19.73% | 863,228 | 27.5% |
[ 20.0% - 20.5% ] 20.19% | 1,263,807 | 29.5% |
[ 20.5% - 21.0% ] 20.71% | 1,289,374 | 27.7% |
[ 21.0% - 21.5% ] 21.27% | 610,995 | 29.0% |
[ 21.5% - 22.0% ] 21.80% | 1,625,216 | 23.1% |
[ 22.0% - 22.5% ] 22.21% | 599,274 | 28.4% |
[ 22.5% - 23.0% ] 22.75% | 740,470 | 32.7% |
[ 23.0% - 23.5% ] 23.23% | 653,987 | 33.4% |
[ 23.5% - 24.0% ] 23.75% | 695,257 | 29.1% |
[ 24.0% - 24.5% ] 24.26% | 718,694 | 26.5% |
[ 24.5% - 25.0% ] 24.79% | 920,577 | 27.4% |
[ 25.0% - 25.5% ] 25.17% | 150,501 | 23.2% |
[ 25.5% - 26.0% ] 25.71% | 686,654 | 30.0% |
[ 26.0% - 26.5% ] 26.26% | 452,963 | 31.3% |
[ 26.5% - 27.0% ] 26.83% | 1,263,934 | 31.1% |
[ 27.0% - 27.5% ] 27.30% | 477,780 | 30.9% |
[ 27.5% - 28.0% ] 27.83% | 84,580 | 32.5% |
[ 28.0% - 28.5% ] 28.22% | 540,342 | 32.8% |
[ 28.5% - 29.0% ] 28.72% | 260,097 | 28.1% |
[ 29.0% - 29.5% ] 29.28% | 368,262 | 31.2% |
[ 29.5% - 30.0% ] 29.68% | 710,826 | 31.9% |
[ 30.0% - 30.5% ] 30.34% | 317,791 | 28.4% |
[ 30.5% - 31.0% ] 30.88% | 308,289 | 37.1% |
[ 31.0% - 31.5% ] 31.22% | 171,675 | 22.6% |
[ 31.5% - 32.0% ] 31.71% | 488,080 | 41.2% |
[ 32.0% - 32.5% ] 32.24% | 125,570 | 40.1% |
[ 32.5% - 33.0% ] 32.72% | 249,367 | 22.8% |
[ 33.0% - 33.5% ] 33.34% | 227,042 | 44.2% |
[ 33.5% - 34.0% ] 33.72% | 149,933 | 23.6% |
[ 34.0% - 34.5% ] 34.20% | 171,479 | 21.5% |
[ 34.5% - 35.0% ] 34.66% | 356,115 | 29.9% |
[ 35.0% - 35.5% ] 35.17% | 171,322 | 29.9% |
[ 35.5% - 36.0% ] 35.77% | 191,381 | 21.8% |
[ 36.0% - 36.5% ] 36.31% | 306,537 | 27.5% |
[ 36.5% - 37.0% ] 36.62% | 231,065 | 24.0% |
[ 37.0% - 37.5% ] 37.34% | 70,484 | 30.1% |
[ 37.5% - 38.0% ] 37.78% | 99,712 | 34.5% |
[ 38.0% - 38.5% ] 38.20% | 328,554 | 24.9% |
[ 38.5% - 39.0% ] 38.64% | 505,027 | 30.1% |
[ 39.0% - 39.5% ] 39.36% | 225,798 | 33.8% |
[ 39.5% - 40.0% ] 39.87% | 276,472 | 25.4% |
[ 40.0% - 40.5% ] 40.35% | 67,577 | 29.7% |
[ 40.5% - 41.0% ] 40.69% | 109,337 | 31.5% |
[ 41.5% - 42.0% ] 41.74% | 63,360 | 17.5% |
[ 42.0% - 42.5% ] 42.38% | 339,583 | 33.5% |
[ 42.5% - 43.0% ] 42.74% | 173,120 | 27.8% |
[ 43.5% - 44.0% ] 43.89% | 139,016 | 13.3% |
[ 44.0% - 44.5% ] 44.23% | 139,629 | 14.0% |
[ 44.5% - 45.0% ] 44.79% | 127,809 | 18.0% |
[ 45.0% - 45.5% ] 45.10% | 20,693 | 43.1% |
[ 45.5% - 46.0% ] 45.62% | 66,361 | 24.0% |
[ 46.0% - 46.5% ] 46.17% | 40,462 | 9.2% |
[ 46.5% - 47.0% ] 46.76% | 53,256 | 46.1% |
[ 47.0% - 47.5% ] 47.26% | 109,289 | 29.9% |
[ 47.5% - 48.0% ] 47.75% | 321,759 | 43.8% |
[ 48.5% - 49.0% ] 48.54% | 14,371 | 18.3% |
[ 50.0% - 50.5% ] 50.31% | 57,649 | 40.2% |
[ 51.5% - 52.0% ] 51.97% | 26,418 | 29.9% |
[ 52.0% - 52.5% ] 52.22% | 30,916 | 43.4% |
[ 53.5% - 54.0% ] 53.91% | 53,371 | 19.7% |
[ 56.5% - 57.0% ] 56.92% | 766 | 16.8% |
[ 58.5% - 59.0% ] 58.82% | 79,495 | 23.5% |
[ 66.5% - 67.0% ] 66.69% | 2,996 | 26.6% |