Immigrants from Asia Disability Age Under 5
COMPARE
Immigrants from Asia
Select to Compare
Disability Age Under 5
Immigrants from Asia Disability Age Under 5
1.1%
DISABILITY | AGE UNDER 5
99.8/ 100
METRIC RATING
44th/ 347
METRIC RANK
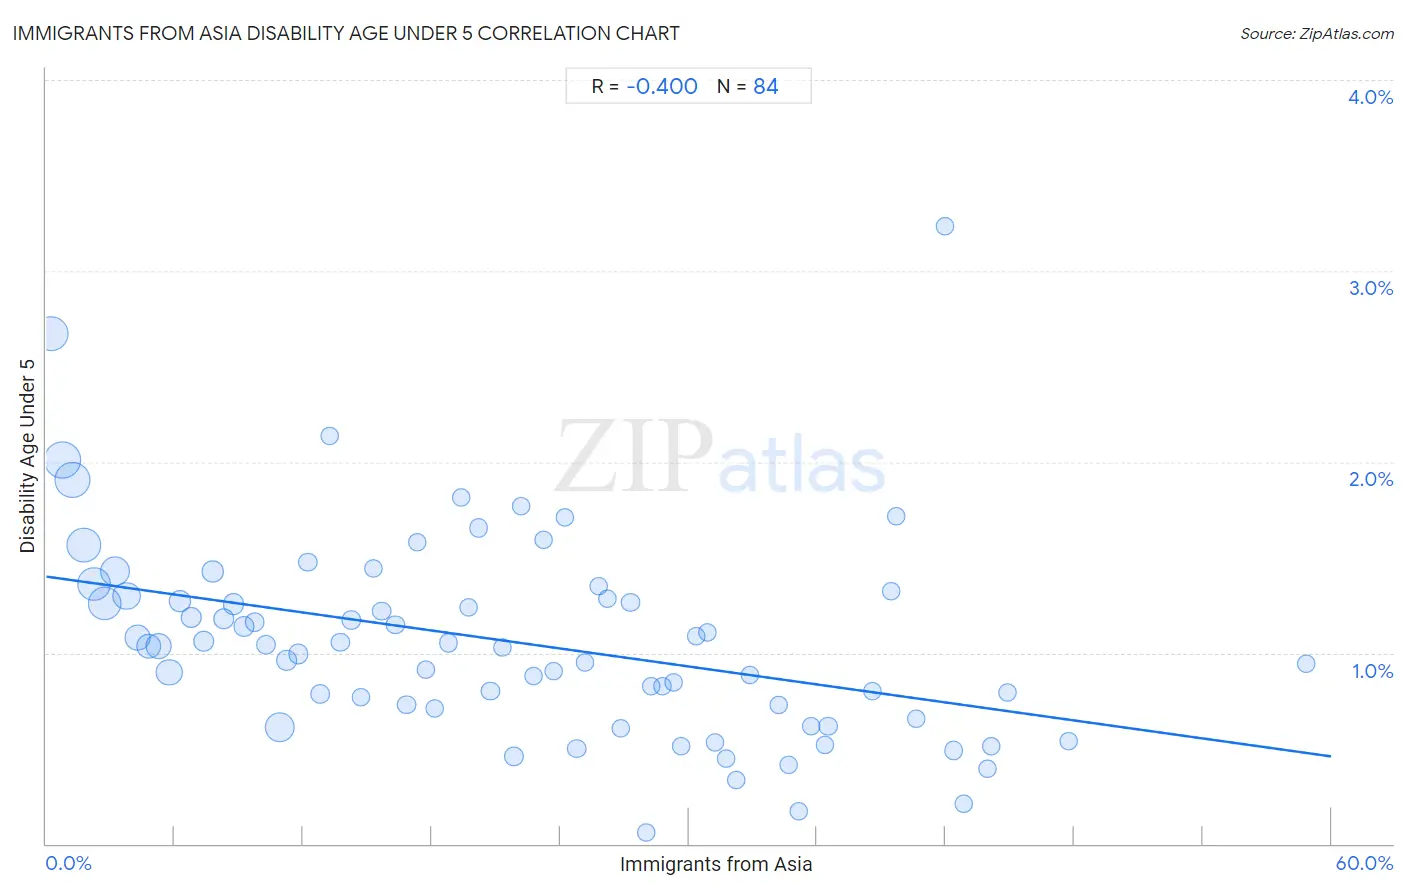
Immigrants from Asia Disability Age Under 5 Correlation Chart
The statistical analysis conducted on geographies consisting of 258,370,039 people shows a moderate negative correlation between the proportion of Immigrants from Asia and percentage of population with a disability under the age of 5 in the United States with a correlation coefficient (R) of -0.400 and weighted average of 1.1%. On average, for every 1% (one percent) increase in Immigrants from Asia within a typical geography, there is a decrease of 0.016% in percentage of population with a disability under the age of 5.
It is essential to understand that the correlation between the percentage of Immigrants from Asia and percentage of population with a disability under the age of 5 does not imply a direct cause-and-effect relationship. It remains uncertain whether the presence of Immigrants from Asia influences an upward or downward trend in the level of percentage of population with a disability under the age of 5 within an area, or if Immigrants from Asia simply ended up residing in those areas with higher or lower levels of percentage of population with a disability under the age of 5 due to other factors.
Demographics Similar to Immigrants from Asia by Disability Age Under 5
In terms of disability age under 5, the demographic groups most similar to Immigrants from Asia are Pima (1.1%, a difference of 0.090%), Immigrants from Bulgaria (1.1%, a difference of 0.11%), Thai (1.1%, a difference of 0.21%), Immigrants from Turkey (1.1%, a difference of 0.22%), and Immigrants from Albania (1.1%, a difference of 0.61%).
| Demographics | Rating | Rank | Disability Age Under 5 |
| Immigrants from India | 99.9 /100 | #37 | Exceptional 1.0% |
| Immigrants from Guyana | 99.9 /100 | #38 | Exceptional 1.0% |
| Filipinos | 99.9 /100 | #39 | Exceptional 1.1% |
| Immigrants from Albania | 99.9 /100 | #40 | Exceptional 1.1% |
| Thais | 99.8 /100 | #41 | Exceptional 1.1% |
| Immigrants from Bulgaria | 99.8 /100 | #42 | Exceptional 1.1% |
| Pima | 99.8 /100 | #43 | Exceptional 1.1% |
| Immigrants from Asia | 99.8 /100 | #44 | Exceptional 1.1% |
| Immigrants from Turkey | 99.8 /100 | #45 | Exceptional 1.1% |
| Immigrants from Congo | 99.8 /100 | #46 | Exceptional 1.1% |
| Immigrants from Sweden | 99.8 /100 | #47 | Exceptional 1.1% |
| Immigrants from Singapore | 99.7 /100 | #48 | Exceptional 1.1% |
| Immigrants from Russia | 99.7 /100 | #49 | Exceptional 1.1% |
| Immigrants from Japan | 99.7 /100 | #50 | Exceptional 1.1% |
| Immigrants from Kazakhstan | 99.7 /100 | #51 | Exceptional 1.1% |
Immigrants from Asia Disability Age Under 5 Correlation Summary
| Measurement | Immigrants from Asia Data | Disability Age Under 5 Data |
| Minimum | 0.26% | 0.058% |
| Maximum | 58.8% | 3.2% |
| Range | 58.6% | 3.2% |
| Mean | 21.8% | 1.1% |
| Median | 21.0% | 1.0% |
| Interquartile 25% (IQ1) | 10.6% | 0.72% |
| Interquartile 75% (IQ3) | 31.5% | 1.3% |
| Interquartile Range (IQR) | 20.9% | 0.57% |
| Standard Deviation (Sample) | 13.5% | 0.53% |
| Standard Deviation (Population) | 13.4% | 0.53% |
Correlation Details
| Immigrants from Asia Percentile | Sample Size | Disability Age Under 5 |
[ 0.0% - 0.5% ] 0.26% | 20,547,288 | 2.7% |
[ 0.5% - 1.0% ] 0.75% | 23,558,789 | 2.0% |
[ 1.0% - 1.5% ] 1.25% | 22,100,066 | 1.9% |
[ 1.5% - 2.0% ] 1.75% | 20,158,121 | 1.6% |
[ 2.0% - 2.5% ] 2.24% | 18,169,180 | 1.4% |
[ 2.5% - 3.0% ] 2.72% | 19,723,467 | 1.3% |
[ 3.0% - 3.5% ] 3.22% | 14,077,282 | 1.4% |
[ 3.5% - 4.0% ] 3.75% | 11,674,281 | 1.3% |
[ 4.0% - 4.5% ] 4.25% | 9,167,600 | 1.1% |
[ 4.5% - 5.0% ] 4.77% | 7,977,884 | 1.0% |
[ 5.0% - 5.5% ] 5.24% | 9,802,977 | 1.0% |
[ 5.5% - 6.0% ] 5.74% | 9,781,116 | 0.90% |
[ 6.0% - 6.5% ] 6.25% | 4,922,167 | 1.3% |
[ 6.5% - 7.0% ] 6.75% | 3,255,099 | 1.2% |
[ 7.0% - 7.5% ] 7.36% | 3,126,101 | 1.1% |
[ 7.5% - 8.0% ] 7.77% | 4,129,369 | 1.4% |
[ 8.0% - 8.5% ] 8.29% | 3,058,868 | 1.2% |
[ 8.5% - 9.0% ] 8.74% | 3,714,273 | 1.3% |
[ 9.0% - 9.5% ] 9.22% | 2,550,550 | 1.1% |
[ 9.5% - 10.0% ] 9.74% | 2,393,709 | 1.2% |
[ 10.0% - 10.5% ] 10.25% | 2,301,966 | 1.0% |
[ 10.5% - 11.0% ] 10.90% | 14,761,075 | 0.61% |
[ 11.0% - 11.5% ] 11.23% | 2,182,090 | 0.96% |
[ 11.5% - 12.0% ] 11.77% | 2,661,827 | 1.00% |
[ 12.0% - 12.5% ] 12.23% | 759,164 | 1.5% |
[ 12.5% - 13.0% ] 12.78% | 1,137,632 | 0.78% |
[ 13.0% - 13.5% ] 13.24% | 771,788 | 2.1% |
[ 13.5% - 14.0% ] 13.72% | 652,483 | 1.1% |
[ 14.0% - 14.5% ] 14.25% | 1,464,754 | 1.2% |
[ 14.5% - 15.0% ] 14.70% | 744,668 | 0.77% |
[ 15.0% - 15.5% ] 15.27% | 820,790 | 1.4% |
[ 15.5% - 16.0% ] 15.66% | 493,236 | 1.2% |
[ 16.0% - 16.5% ] 16.30% | 601,932 | 1.1% |
[ 16.5% - 17.0% ] 16.81% | 718,745 | 0.73% |
[ 17.0% - 17.5% ] 17.34% | 672,835 | 1.6% |
[ 17.5% - 18.0% ] 17.73% | 944,920 | 0.91% |
[ 18.0% - 18.5% ] 18.15% | 813,504 | 0.71% |
[ 18.5% - 19.0% ] 18.78% | 676,358 | 1.1% |
[ 19.0% - 19.5% ] 19.35% | 156,201 | 1.8% |
[ 19.5% - 20.0% ] 19.72% | 427,200 | 1.2% |
[ 20.0% - 20.5% ] 20.20% | 434,238 | 1.7% |
[ 20.5% - 21.0% ] 20.74% | 510,907 | 0.80% |
[ 21.0% - 21.5% ] 21.28% | 201,712 | 1.0% |
[ 21.5% - 22.0% ] 21.83% | 1,183,165 | 0.46% |
[ 22.0% - 22.5% ] 22.18% | 301,431 | 1.8% |
[ 22.5% - 23.0% ] 22.74% | 496,160 | 0.88% |
[ 23.0% - 23.5% ] 23.21% | 418,975 | 1.6% |
[ 23.5% - 24.0% ] 23.72% | 259,605 | 0.90% |
[ 24.0% - 24.5% ] 24.21% | 370,287 | 1.7% |
[ 24.5% - 25.0% ] 24.77% | 416,714 | 0.50% |
[ 25.0% - 25.5% ] 25.16% | 86,901 | 0.95% |
[ 25.5% - 26.0% ] 25.80% | 184,343 | 1.4% |
[ 26.0% - 26.5% ] 26.20% | 205,715 | 1.3% |
[ 26.5% - 27.0% ] 26.83% | 1,103,569 | 0.60% |
[ 27.0% - 27.5% ] 27.28% | 252,960 | 1.3% |
[ 27.5% - 28.0% ] 28.00% | 29,544 | 0.058% |
[ 28.0% - 28.5% ] 28.26% | 141,976 | 0.82% |
[ 28.5% - 29.0% ] 28.78% | 72,605 | 0.83% |
[ 29.0% - 29.5% ] 29.29% | 254,318 | 0.84% |
[ 29.5% - 30.0% ] 29.63% | 255,137 | 0.51% |
[ 30.0% - 30.5% ] 30.37% | 149,501 | 1.1% |
[ 30.5% - 31.0% ] 30.90% | 253,099 | 1.1% |
[ 31.0% - 31.5% ] 31.20% | 79,447 | 0.53% |
[ 31.5% - 32.0% ] 31.73% | 378,255 | 0.44% |
[ 32.0% - 32.5% ] 32.22% | 91,618 | 0.34% |
[ 32.5% - 33.0% ] 32.87% | 109,369 | 0.88% |
[ 34.0% - 34.5% ] 34.19% | 144,764 | 0.72% |
[ 34.5% - 35.0% ] 34.66% | 352,539 | 0.41% |
[ 35.0% - 35.5% ] 35.13% | 59,386 | 0.17% |
[ 35.5% - 36.0% ] 35.74% | 153,740 | 0.62% |
[ 36.0% - 36.5% ] 36.33% | 172,773 | 0.52% |
[ 36.5% - 37.0% ] 36.51% | 111,035 | 0.61% |
[ 38.5% - 39.0% ] 38.57% | 251,128 | 0.80% |
[ 39.0% - 39.5% ] 39.44% | 127,803 | 1.3% |
[ 39.5% - 40.0% ] 39.67% | 36,657 | 1.7% |
[ 40.5% - 41.0% ] 40.65% | 90,659 | 0.65% |
[ 41.5% - 42.0% ] 41.97% | 22,622 | 3.2% |
[ 42.0% - 42.5% ] 42.38% | 329,265 | 0.49% |
[ 42.5% - 43.0% ] 42.82% | 44,570 | 0.21% |
[ 43.5% - 44.0% ] 43.93% | 43,851 | 0.39% |
[ 44.0% - 44.5% ] 44.10% | 88,586 | 0.51% |
[ 44.5% - 45.0% ] 44.87% | 88,598 | 0.79% |
[ 47.5% - 48.0% ] 47.76% | 279,662 | 0.54% |
[ 58.5% - 59.0% ] 58.82% | 79,495 | 0.94% |