Immigrants from Asia 2 or more Vehicles in Household
COMPARE
Immigrants from Asia
Select to Compare
2 or more Vehicles in Household
Immigrants from Asia 2 or more Vehicles in Household
56.3%
2+ VEHICLES AVAILABLE
86.0/ 100
METRIC RATING
136th/ 347
METRIC RANK
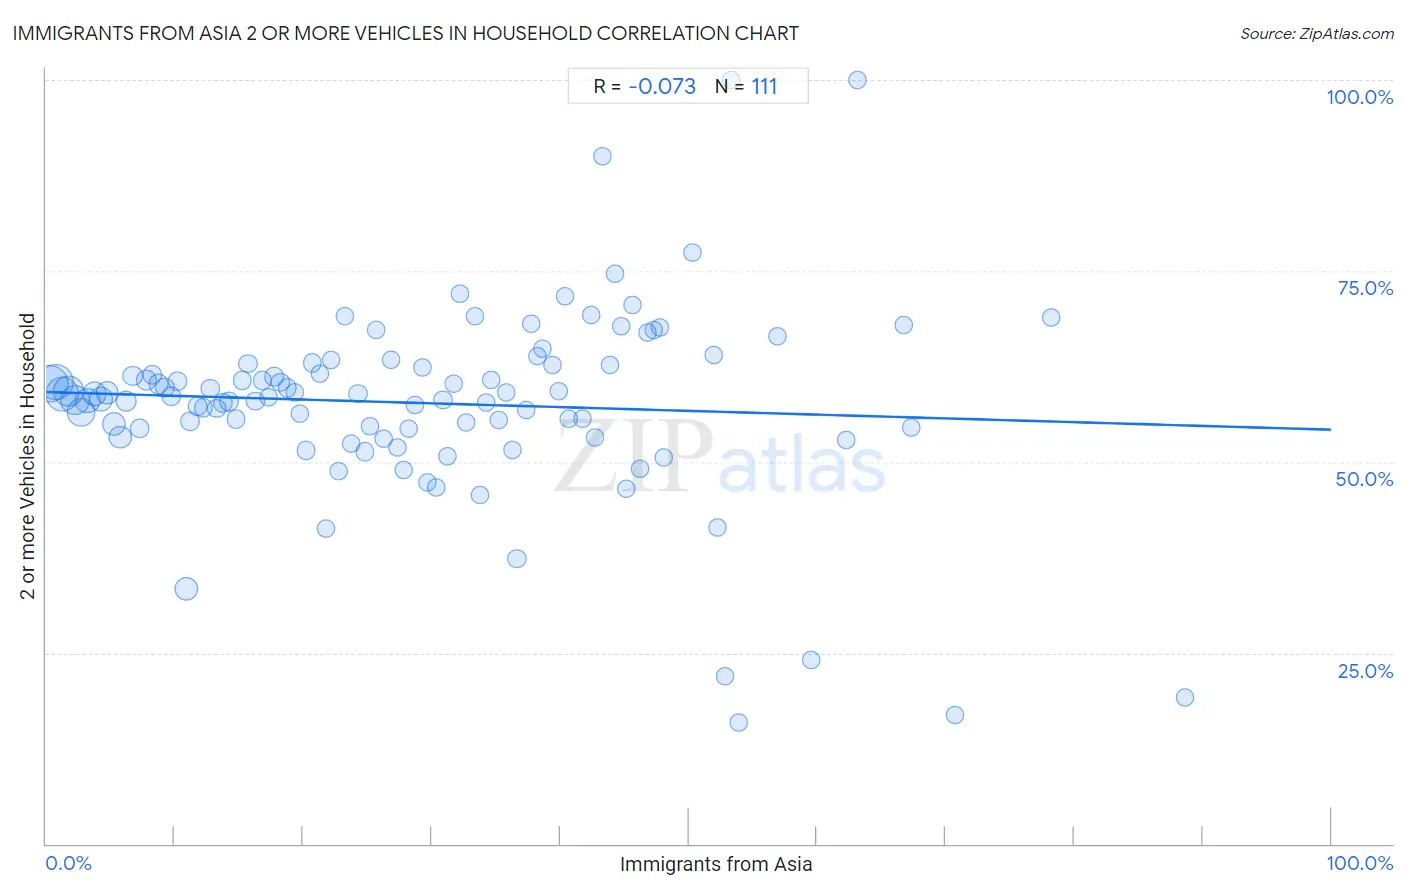
Immigrants from Asia 2 or more Vehicles in Household Correlation Chart
The statistical analysis conducted on geographies consisting of 548,501,460 people shows a slight negative correlation between the proportion of Immigrants from Asia and percentage of households with 2 or more vehicles available in the United States with a correlation coefficient (R) of -0.073 and weighted average of 56.3%. On average, for every 1% (one percent) increase in Immigrants from Asia within a typical geography, there is a decrease of 0.049% in percentage of households with 2 or more vehicles available.
It is essential to understand that the correlation between the percentage of Immigrants from Asia and percentage of households with 2 or more vehicles available does not imply a direct cause-and-effect relationship. It remains uncertain whether the presence of Immigrants from Asia influences an upward or downward trend in the level of percentage of households with 2 or more vehicles available within an area, or if Immigrants from Asia simply ended up residing in those areas with higher or lower levels of percentage of households with 2 or more vehicles available due to other factors.
Demographics Similar to Immigrants from Asia by 2 or more Vehicles in Household
In terms of 2 or more vehicles in household, the demographic groups most similar to Immigrants from Asia are Blackfeet (56.4%, a difference of 0.040%), Immigrants from the Azores (56.4%, a difference of 0.050%), Cuban (56.3%, a difference of 0.090%), Salvadoran (56.3%, a difference of 0.10%), and Armenian (56.3%, a difference of 0.13%).
| Demographics | Rating | Rank | 2 or more Vehicles in Household |
| Ute | 90.4 /100 | #129 | Exceptional 56.6% |
| Yugoslavians | 90.0 /100 | #130 | Exceptional 56.6% |
| Bulgarians | 89.7 /100 | #131 | Excellent 56.5% |
| Hungarians | 89.1 /100 | #132 | Excellent 56.5% |
| Comanche | 88.4 /100 | #133 | Excellent 56.5% |
| Immigrants from the Azores | 86.6 /100 | #134 | Excellent 56.4% |
| Blackfeet | 86.5 /100 | #135 | Excellent 56.4% |
| Immigrants from Asia | 86.0 /100 | #136 | Excellent 56.3% |
| Cubans | 84.8 /100 | #137 | Excellent 56.3% |
| Salvadorans | 84.7 /100 | #138 | Excellent 56.3% |
| Armenians | 84.3 /100 | #139 | Excellent 56.3% |
| Latvians | 83.6 /100 | #140 | Excellent 56.2% |
| Immigrants from Cambodia | 83.6 /100 | #141 | Excellent 56.2% |
| South Africans | 83.1 /100 | #142 | Excellent 56.2% |
| Seminole | 81.7 /100 | #143 | Excellent 56.2% |
Immigrants from Asia 2 or more Vehicles in Household Correlation Summary
| Measurement | Immigrants from Asia Data | 2 or more Vehicles in Household Data |
| Minimum | 0.26% | 15.8% |
| Maximum | 88.7% | 100.0% |
| Range | 88.4% | 84.2% |
| Mean | 29.2% | 57.7% |
| Median | 27.8% | 58.5% |
| Interquartile 25% (IQ1) | 13.7% | 54.4% |
| Interquartile 75% (IQ3) | 42.4% | 62.7% |
| Interquartile Range (IQR) | 28.6% | 8.2% |
| Standard Deviation (Sample) | 18.8% | 12.7% |
| Standard Deviation (Population) | 18.7% | 12.6% |
Correlation Details
| Immigrants from Asia Percentile | Sample Size | 2 or more Vehicles in Household |
[ 0.0% - 0.5% ] 0.26% | 65,585,161 | 60.2% |
[ 0.5% - 1.0% ] 0.74% | 64,682,861 | 60.5% |
[ 1.0% - 1.5% ] 1.24% | 54,137,945 | 58.8% |
[ 1.5% - 2.0% ] 1.74% | 45,012,010 | 59.2% |
[ 2.0% - 2.5% ] 2.24% | 38,801,960 | 58.1% |
[ 2.5% - 3.0% ] 2.73% | 36,045,724 | 56.4% |
[ 3.0% - 3.5% ] 3.23% | 26,108,098 | 58.0% |
[ 3.5% - 4.0% ] 3.75% | 21,248,475 | 58.9% |
[ 4.0% - 4.5% ] 4.25% | 19,100,640 | 58.2% |
[ 4.5% - 5.0% ] 4.75% | 15,677,806 | 59.1% |
[ 5.0% - 5.5% ] 5.24% | 16,291,815 | 55.0% |
[ 5.5% - 6.0% ] 5.74% | 15,563,185 | 53.2% |
[ 6.0% - 6.5% ] 6.25% | 9,517,215 | 57.9% |
[ 6.5% - 7.0% ] 6.75% | 6,874,789 | 61.2% |
[ 7.0% - 7.5% ] 7.29% | 6,939,760 | 54.4% |
[ 7.5% - 8.0% ] 7.77% | 7,414,435 | 60.7% |
[ 8.0% - 8.5% ] 8.27% | 5,876,027 | 61.4% |
[ 8.5% - 9.0% ] 8.73% | 6,591,801 | 60.2% |
[ 9.0% - 9.5% ] 9.22% | 4,812,416 | 59.7% |
[ 9.5% - 10.0% ] 9.74% | 4,419,713 | 58.5% |
[ 10.0% - 10.5% ] 10.23% | 4,473,674 | 60.5% |
[ 10.5% - 11.0% ] 10.88% | 16,902,980 | 33.4% |
[ 11.0% - 11.5% ] 11.23% | 4,178,374 | 55.4% |
[ 11.5% - 12.0% ] 11.76% | 4,084,684 | 57.2% |
[ 12.0% - 12.5% ] 12.22% | 2,407,892 | 57.1% |
[ 12.5% - 13.0% ] 12.78% | 2,627,945 | 59.6% |
[ 13.0% - 13.5% ] 13.24% | 2,262,134 | 57.0% |
[ 13.5% - 14.0% ] 13.73% | 2,008,014 | 57.7% |
[ 14.0% - 14.5% ] 14.24% | 2,626,723 | 57.9% |
[ 14.5% - 15.0% ] 14.76% | 1,838,493 | 55.6% |
[ 15.0% - 15.5% ] 15.26% | 1,761,595 | 60.7% |
[ 15.5% - 16.0% ] 15.71% | 1,140,235 | 62.9% |
[ 16.0% - 16.5% ] 16.29% | 1,303,656 | 57.9% |
[ 16.5% - 17.0% ] 16.81% | 1,426,057 | 60.7% |
[ 17.0% - 17.5% ] 17.27% | 1,335,979 | 58.5% |
[ 17.5% - 18.0% ] 17.74% | 1,570,617 | 61.2% |
[ 18.0% - 18.5% ] 18.24% | 1,628,861 | 60.5% |
[ 18.5% - 19.0% ] 18.74% | 1,374,846 | 59.7% |
[ 19.0% - 19.5% ] 19.34% | 937,312 | 59.1% |
[ 19.5% - 20.0% ] 19.73% | 864,060 | 56.3% |
[ 20.0% - 20.5% ] 20.19% | 1,266,061 | 51.5% |
[ 20.5% - 21.0% ] 20.71% | 1,289,767 | 62.9% |
[ 21.0% - 21.5% ] 21.27% | 603,153 | 61.6% |
[ 21.5% - 22.0% ] 21.80% | 1,625,576 | 41.2% |
[ 22.0% - 22.5% ] 22.21% | 599,946 | 63.4% |
[ 22.5% - 23.0% ] 22.75% | 740,470 | 48.8% |
[ 23.0% - 23.5% ] 23.23% | 653,987 | 69.1% |
[ 23.5% - 24.0% ] 23.75% | 695,257 | 52.4% |
[ 24.0% - 24.5% ] 24.26% | 718,884 | 59.0% |
[ 24.5% - 25.0% ] 24.79% | 920,797 | 51.3% |
[ 25.0% - 25.5% ] 25.17% | 151,639 | 54.7% |
[ 25.5% - 26.0% ] 25.71% | 687,253 | 67.3% |
[ 26.0% - 26.5% ] 26.26% | 453,893 | 53.1% |
[ 26.5% - 27.0% ] 26.83% | 1,266,078 | 63.4% |
[ 27.0% - 27.5% ] 27.30% | 477,891 | 51.9% |
[ 27.5% - 28.0% ] 27.83% | 87,044 | 49.0% |
[ 28.0% - 28.5% ] 28.22% | 540,342 | 54.4% |
[ 28.5% - 29.0% ] 28.72% | 261,052 | 57.5% |
[ 29.0% - 29.5% ] 29.28% | 368,296 | 62.3% |
[ 29.5% - 30.0% ] 29.68% | 710,826 | 47.3% |
[ 30.0% - 30.5% ] 30.34% | 318,528 | 46.7% |
[ 30.5% - 31.0% ] 30.88% | 309,738 | 58.2% |
[ 31.0% - 31.5% ] 31.22% | 171,675 | 50.7% |
[ 31.5% - 32.0% ] 31.71% | 488,550 | 60.3% |
[ 32.0% - 32.5% ] 32.24% | 125,880 | 72.0% |
[ 32.5% - 33.0% ] 32.72% | 251,495 | 55.2% |
[ 33.0% - 33.5% ] 33.34% | 227,042 | 69.0% |
[ 33.5% - 34.0% ] 33.72% | 149,933 | 45.6% |
[ 34.0% - 34.5% ] 34.20% | 171,820 | 57.9% |
[ 34.5% - 35.0% ] 34.66% | 356,115 | 60.7% |
[ 35.0% - 35.5% ] 35.17% | 171,322 | 55.4% |
[ 35.5% - 36.0% ] 35.77% | 191,381 | 59.1% |
[ 36.0% - 36.5% ] 36.31% | 306,683 | 51.5% |
[ 36.5% - 37.0% ] 36.62% | 231,114 | 37.4% |
[ 37.0% - 37.5% ] 37.34% | 70,767 | 56.7% |
[ 37.5% - 38.0% ] 37.78% | 99,712 | 68.1% |
[ 38.0% - 38.5% ] 38.20% | 328,554 | 63.8% |
[ 38.5% - 39.0% ] 38.64% | 503,242 | 64.8% |
[ 39.0% - 39.5% ] 39.36% | 225,902 | 62.7% |
[ 39.5% - 40.0% ] 39.87% | 276,472 | 59.3% |
[ 40.0% - 40.5% ] 40.35% | 67,577 | 71.7% |
[ 40.5% - 41.0% ] 40.69% | 109,364 | 55.6% |
[ 41.5% - 42.0% ] 41.74% | 63,360 | 55.7% |
[ 42.0% - 42.5% ] 42.38% | 342,913 | 69.3% |
[ 42.5% - 43.0% ] 42.74% | 173,120 | 53.2% |
[ 43.0% - 43.5% ] 43.28% | 305 | 90.1% |
[ 43.5% - 44.0% ] 43.89% | 139,016 | 62.6% |
[ 44.0% - 44.5% ] 44.23% | 140,768 | 74.6% |
[ 44.5% - 45.0% ] 44.79% | 127,809 | 67.7% |
[ 45.0% - 45.5% ] 45.11% | 21,250 | 46.4% |
[ 45.5% - 46.0% ] 45.62% | 66,590 | 70.5% |
[ 46.0% - 46.5% ] 46.17% | 40,462 | 49.1% |
[ 46.5% - 47.0% ] 46.76% | 53,256 | 66.9% |
[ 47.0% - 47.5% ] 47.26% | 109,289 | 67.2% |
[ 47.5% - 48.0% ] 47.75% | 321,759 | 67.6% |
[ 48.0% - 48.5% ] 48.01% | 277 | 50.5% |
[ 50.0% - 50.5% ] 50.31% | 57,649 | 77.4% |
[ 51.5% - 52.0% ] 51.97% | 26,418 | 64.0% |
[ 52.0% - 52.5% ] 52.22% | 30,916 | 41.4% |
[ 52.5% - 53.0% ] 52.78% | 144 | 22.0% |
[ 53.0% - 53.5% ] 53.35% | 954 | 100.0% |
[ 53.5% - 54.0% ] 53.91% | 53,371 | 15.8% |
[ 56.5% - 57.0% ] 56.92% | 766 | 66.4% |
[ 59.5% - 60.0% ] 59.57% | 188 | 24.0% |
[ 62.0% - 62.5% ] 62.24% | 143 | 52.9% |
[ 63.0% - 63.5% ] 63.10% | 84 | 100.0% |
[ 66.5% - 67.0% ] 66.69% | 2,996 | 67.9% |
[ 67.0% - 67.5% ] 67.35% | 49 | 54.5% |
[ 70.5% - 71.0% ] 70.75% | 147 | 16.8% |
[ 78.0% - 78.5% ] 78.18% | 275 | 68.8% |
[ 88.5% - 89.0% ] 88.65% | 141 | 19.2% |