Immigrants from Argentina 4 or more Vehicles in Household
COMPARE
Immigrants from Argentina
Select to Compare
4 or more Vehicles in Household
Immigrants from Argentina 4 or more Vehicles in Household
5.9%
4+ VEHICLES AVAILABLE
6.0/ 100
METRIC RATING
232nd/ 347
METRIC RANK
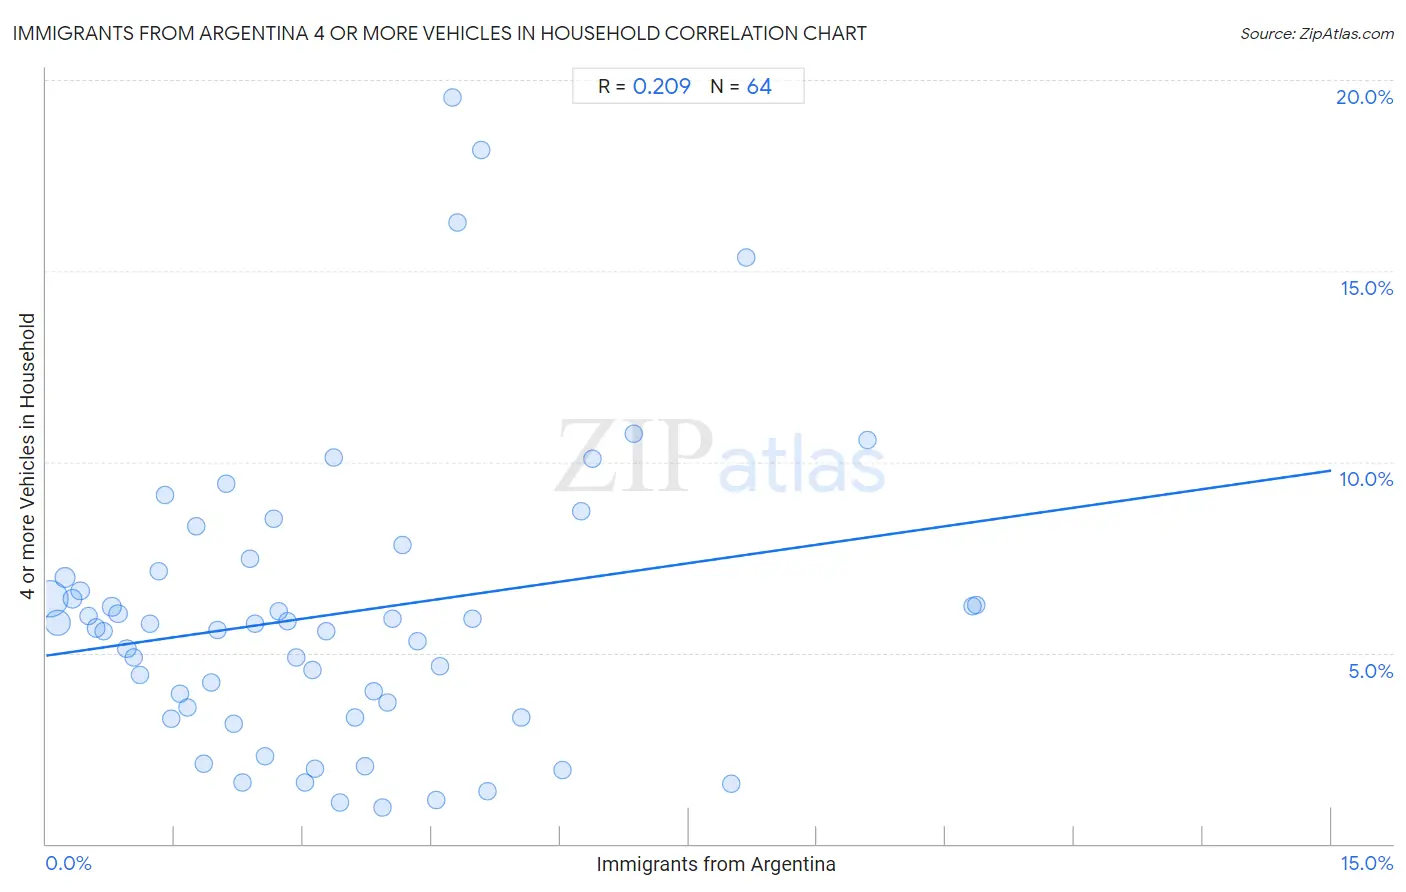
Immigrants from Argentina 4 or more Vehicles in Household Correlation Chart
The statistical analysis conducted on geographies consisting of 263,256,749 people shows a weak positive correlation between the proportion of Immigrants from Argentina and percentage of households with 4 or more vehicles available in the United States with a correlation coefficient (R) of 0.209 and weighted average of 5.9%. On average, for every 1% (one percent) increase in Immigrants from Argentina within a typical geography, there is an increase of 0.32% in percentage of households with 4 or more vehicles available.
It is essential to understand that the correlation between the percentage of Immigrants from Argentina and percentage of households with 4 or more vehicles available does not imply a direct cause-and-effect relationship. It remains uncertain whether the presence of Immigrants from Argentina influences an upward or downward trend in the level of percentage of households with 4 or more vehicles available within an area, or if Immigrants from Argentina simply ended up residing in those areas with higher or lower levels of percentage of households with 4 or more vehicles available due to other factors.
Demographics Similar to Immigrants from Argentina by 4 or more Vehicles in Household
In terms of 4 or more vehicles in household, the demographic groups most similar to Immigrants from Argentina are Sierra Leonean (5.9%, a difference of 0.010%), Immigrants from Switzerland (5.9%, a difference of 0.18%), Immigrants from Malaysia (5.9%, a difference of 0.30%), Eastern European (5.9%, a difference of 0.37%), and Immigrants from Uganda (5.9%, a difference of 0.65%).
| Demographics | Rating | Rank | 4 or more Vehicles in Household |
| Indonesians | 8.9 /100 | #225 | Tragic 6.0% |
| Immigrants from Singapore | 7.9 /100 | #226 | Tragic 5.9% |
| Immigrants from Western Asia | 7.8 /100 | #227 | Tragic 5.9% |
| Immigrants from Uganda | 7.5 /100 | #228 | Tragic 5.9% |
| Eastern Europeans | 6.8 /100 | #229 | Tragic 5.9% |
| Immigrants from Malaysia | 6.7 /100 | #230 | Tragic 5.9% |
| Immigrants from Switzerland | 6.4 /100 | #231 | Tragic 5.9% |
| Immigrants from Argentina | 6.0 /100 | #232 | Tragic 5.9% |
| Sierra Leoneans | 6.0 /100 | #233 | Tragic 5.9% |
| Africans | 4.6 /100 | #234 | Tragic 5.8% |
| Immigrants from Hungary | 4.6 /100 | #235 | Tragic 5.8% |
| Immigrants from Eritrea | 4.5 /100 | #236 | Tragic 5.8% |
| Turks | 4.1 /100 | #237 | Tragic 5.8% |
| Immigrants from Belgium | 4.0 /100 | #238 | Tragic 5.8% |
| Immigrants from Australia | 3.8 /100 | #239 | Tragic 5.8% |
Immigrants from Argentina 4 or more Vehicles in Household Correlation Summary
| Measurement | Immigrants from Argentina Data | 4 or more Vehicles in Household Data |
| Minimum | 0.040% | 0.94% |
| Maximum | 10.9% | 19.5% |
| Range | 10.8% | 18.6% |
| Mean | 3.3% | 6.0% |
| Median | 2.9% | 5.7% |
| Interquartile 25% (IQ1) | 1.4% | 3.4% |
| Interquartile 75% (IQ3) | 4.6% | 7.1% |
| Interquartile Range (IQR) | 3.2% | 3.6% |
| Standard Deviation (Sample) | 2.5% | 3.9% |
| Standard Deviation (Population) | 2.5% | 3.8% |
Correlation Details
| Immigrants from Argentina Percentile | Sample Size | 4 or more Vehicles in Household |
[ 0.0% - 0.5% ] 0.040% | 155,085,379 | 6.4% |
[ 0.0% - 0.5% ] 0.13% | 58,042,300 | 5.8% |
[ 0.0% - 0.5% ] 0.22% | 20,223,614 | 7.0% |
[ 0.0% - 0.5% ] 0.31% | 10,287,302 | 6.4% |
[ 0.0% - 0.5% ] 0.40% | 6,717,340 | 6.6% |
[ 0.0% - 0.5% ] 0.49% | 3,321,597 | 6.0% |
[ 0.5% - 1.0% ] 0.58% | 2,074,734 | 5.6% |
[ 0.5% - 1.0% ] 0.67% | 1,554,201 | 5.6% |
[ 0.5% - 1.0% ] 0.77% | 887,513 | 6.2% |
[ 0.5% - 1.0% ] 0.84% | 676,202 | 6.0% |
[ 0.5% - 1.0% ] 0.94% | 783,216 | 5.1% |
[ 1.0% - 1.5% ] 1.03% | 330,982 | 4.9% |
[ 1.0% - 1.5% ] 1.10% | 753,716 | 4.4% |
[ 1.0% - 1.5% ] 1.21% | 459,945 | 5.8% |
[ 1.0% - 1.5% ] 1.31% | 327,415 | 7.1% |
[ 1.0% - 1.5% ] 1.39% | 40,691 | 9.1% |
[ 1.0% - 1.5% ] 1.46% | 35,321 | 3.3% |
[ 1.5% - 2.0% ] 1.57% | 233,508 | 3.9% |
[ 1.5% - 2.0% ] 1.65% | 311,268 | 3.6% |
[ 1.5% - 2.0% ] 1.75% | 22,688 | 8.3% |
[ 1.5% - 2.0% ] 1.83% | 72,790 | 2.1% |
[ 1.5% - 2.0% ] 1.93% | 80,794 | 4.2% |
[ 1.5% - 2.0% ] 2.00% | 95,762 | 5.6% |
[ 2.0% - 2.5% ] 2.10% | 28,405 | 9.4% |
[ 2.0% - 2.5% ] 2.19% | 59,436 | 3.1% |
[ 2.0% - 2.5% ] 2.29% | 40,692 | 1.6% |
[ 2.0% - 2.5% ] 2.38% | 24,378 | 7.5% |
[ 2.0% - 2.5% ] 2.44% | 9,891 | 5.8% |
[ 2.5% - 3.0% ] 2.56% | 26,814 | 2.3% |
[ 2.5% - 3.0% ] 2.66% | 15,322 | 8.5% |
[ 2.5% - 3.0% ] 2.72% | 54,981 | 6.1% |
[ 2.5% - 3.0% ] 2.82% | 2,414 | 5.8% |
[ 2.5% - 3.0% ] 2.92% | 116,913 | 4.9% |
[ 3.0% - 3.5% ] 3.02% | 44,914 | 1.6% |
[ 3.0% - 3.5% ] 3.11% | 546 | 4.5% |
[ 3.0% - 3.5% ] 3.14% | 46,704 | 2.0% |
[ 3.0% - 3.5% ] 3.27% | 11,753 | 5.6% |
[ 3.0% - 3.5% ] 3.35% | 5,787 | 10.1% |
[ 3.0% - 3.5% ] 3.43% | 42,058 | 1.1% |
[ 3.5% - 4.0% ] 3.61% | 721 | 3.3% |
[ 3.5% - 4.0% ] 3.71% | 36,324 | 2.0% |
[ 3.5% - 4.0% ] 3.83% | 26,436 | 4.0% |
[ 3.5% - 4.0% ] 3.93% | 22,202 | 0.94% |
[ 3.5% - 4.0% ] 3.98% | 5,625 | 3.7% |
[ 4.0% - 4.5% ] 4.04% | 23,734 | 5.9% |
[ 4.0% - 4.5% ] 4.15% | 289 | 7.8% |
[ 4.0% - 4.5% ] 4.33% | 1,777 | 5.3% |
[ 4.5% - 5.0% ] 4.55% | 82,400 | 1.1% |
[ 4.5% - 5.0% ] 4.60% | 16,450 | 4.6% |
[ 4.5% - 5.0% ] 4.74% | 1,288 | 19.5% |
[ 4.5% - 5.0% ] 4.80% | 271 | 16.3% |
[ 4.5% - 5.0% ] 4.97% | 3,098 | 5.9% |
[ 5.0% - 5.5% ] 5.08% | 59 | 18.2% |
[ 5.0% - 5.5% ] 5.15% | 7,800 | 1.4% |
[ 5.5% - 6.0% ] 5.55% | 883 | 3.3% |
[ 6.0% - 6.5% ] 6.03% | 35,967 | 1.9% |
[ 6.0% - 6.5% ] 6.24% | 593 | 8.7% |
[ 6.0% - 6.5% ] 6.37% | 1,381 | 10.1% |
[ 6.5% - 7.0% ] 6.85% | 3,589 | 10.7% |
[ 7.5% - 8.0% ] 7.99% | 5,719 | 1.6% |
[ 8.0% - 8.5% ] 8.17% | 1,041 | 15.4% |
[ 9.5% - 10.0% ] 9.59% | 605 | 10.6% |
[ 10.5% - 11.0% ] 10.81% | 14,639 | 6.2% |
[ 10.5% - 11.0% ] 10.86% | 14,572 | 6.2% |