Immigrants from Argentina Wage/Income Gap
COMPARE
Immigrants from Argentina
Select to Compare
Wage/Income Gap
Immigrants from Argentina Wage/Income Gap
26.8%
WAGE/INCOME GAP
7.2/ 100
METRIC RATING
224th/ 347
METRIC RANK
Immigrants from Argentina Wage/Income Gap Correlation Chart
The statistical analysis conducted on geographies consisting of 264,345,547 people shows a poor positive correlation between the proportion of Immigrants from Argentina and wage/income gap percentage in the United States with a correlation coefficient (R) of 0.156 and weighted average of 26.8%. On average, for every 1% (one percent) increase in Immigrants from Argentina within a typical geography, there is an increase of 0.78% in wage/income gap percentage.
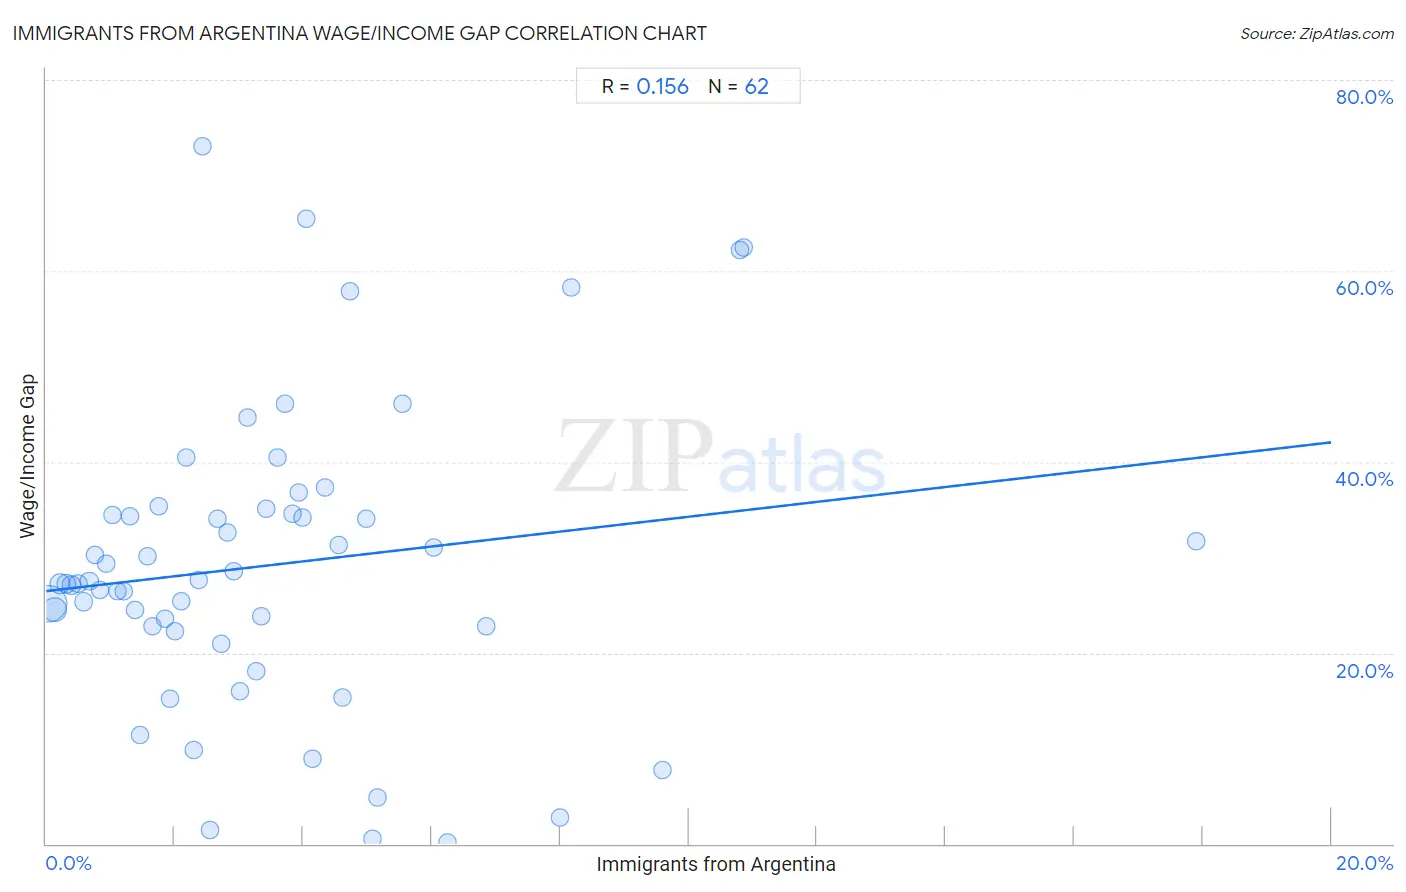
It is essential to understand that the correlation between the percentage of Immigrants from Argentina and wage/income gap percentage does not imply a direct cause-and-effect relationship. It remains uncertain whether the presence of Immigrants from Argentina influences an upward or downward trend in the level of wage/income gap percentage within an area, or if Immigrants from Argentina simply ended up residing in those areas with higher or lower levels of wage/income gap percentage due to other factors.
Demographics Similar to Immigrants from Argentina by Wage/Income Gap
In terms of wage/income gap, the demographic groups most similar to Immigrants from Argentina are Jordanian (26.8%, a difference of 0.17%), Immigrants from Ireland (26.9%, a difference of 0.17%), Bolivian (26.8%, a difference of 0.25%), Immigrants from Spain (26.8%, a difference of 0.28%), and Asian (26.9%, a difference of 0.33%).
| Demographics | Rating | Rank | Wage/Income Gap |
| Brazilians | 9.2 /100 | #217 | Tragic 26.7% |
| Immigrants from Saudi Arabia | 9.1 /100 | #218 | Tragic 26.7% |
| Immigrants from Poland | 8.9 /100 | #219 | Tragic 26.7% |
| Immigrants from Latvia | 8.9 /100 | #220 | Tragic 26.7% |
| Immigrants from Spain | 8.5 /100 | #221 | Tragic 26.8% |
| Bolivians | 8.3 /100 | #222 | Tragic 26.8% |
| Jordanians | 8.0 /100 | #223 | Tragic 26.8% |
| Immigrants from Argentina | 7.2 /100 | #224 | Tragic 26.8% |
| Immigrants from Ireland | 6.5 /100 | #225 | Tragic 26.9% |
| Asians | 5.9 /100 | #226 | Tragic 26.9% |
| Spaniards | 5.6 /100 | #227 | Tragic 27.0% |
| Immigrants from Turkey | 5.6 /100 | #228 | Tragic 27.0% |
| Immigrants from Asia | 5.5 /100 | #229 | Tragic 27.0% |
| Ottawa | 5.3 /100 | #230 | Tragic 27.0% |
| Bhutanese | 5.3 /100 | #231 | Tragic 27.0% |
Immigrants from Argentina Wage/Income Gap Correlation Summary
| Measurement | Immigrants from Argentina Data | Wage/Income Gap Data |
| Minimum | 0.040% | 0.074% |
| Maximum | 17.9% | 73.0% |
| Range | 17.9% | 73.0% |
| Mean | 3.5% | 29.2% |
| Median | 2.8% | 27.4% |
| Interquartile 25% (IQ1) | 1.4% | 22.7% |
| Interquartile 75% (IQ3) | 4.6% | 34.6% |
| Interquartile Range (IQR) | 3.2% | 11.9% |
| Standard Deviation (Sample) | 3.1% | 15.6% |
| Standard Deviation (Population) | 3.1% | 15.5% |
Correlation Details
| Immigrants from Argentina Percentile | Sample Size | Wage/Income Gap |
[ 0.0% - 0.5% ] 0.040% | 155,525,377 | 25.1% |
[ 0.0% - 0.5% ] 0.13% | 58,208,296 | 24.5% |
[ 0.0% - 0.5% ] 0.22% | 20,381,138 | 27.3% |
[ 0.0% - 0.5% ] 0.31% | 10,364,031 | 27.2% |
[ 0.0% - 0.5% ] 0.40% | 6,759,891 | 27.1% |
[ 0.0% - 0.5% ] 0.49% | 3,382,150 | 27.2% |
[ 0.5% - 1.0% ] 0.58% | 2,093,348 | 25.3% |
[ 0.5% - 1.0% ] 0.67% | 1,577,193 | 27.5% |
[ 0.5% - 1.0% ] 0.77% | 887,513 | 30.3% |
[ 0.5% - 1.0% ] 0.84% | 681,343 | 26.6% |
[ 0.5% - 1.0% ] 0.94% | 779,826 | 29.3% |
[ 1.0% - 1.5% ] 1.03% | 361,912 | 34.4% |
[ 1.0% - 1.5% ] 1.10% | 781,284 | 26.5% |
[ 1.0% - 1.5% ] 1.21% | 463,981 | 26.5% |
[ 1.0% - 1.5% ] 1.31% | 326,707 | 34.3% |
[ 1.0% - 1.5% ] 1.38% | 56,575 | 24.5% |
[ 1.0% - 1.5% ] 1.46% | 32,792 | 11.4% |
[ 1.5% - 2.0% ] 1.57% | 237,474 | 30.1% |
[ 1.5% - 2.0% ] 1.65% | 311,268 | 22.8% |
[ 1.5% - 2.0% ] 1.75% | 22,688 | 35.4% |
[ 1.5% - 2.0% ] 1.84% | 102,782 | 23.6% |
[ 1.5% - 2.0% ] 1.93% | 80,794 | 15.2% |
[ 1.5% - 2.0% ] 2.00% | 95,762 | 22.2% |
[ 2.0% - 2.5% ] 2.10% | 28,405 | 25.3% |
[ 2.0% - 2.5% ] 2.19% | 60,288 | 40.5% |
[ 2.0% - 2.5% ] 2.29% | 42,320 | 9.8% |
[ 2.0% - 2.5% ] 2.38% | 25,783 | 27.6% |
[ 2.0% - 2.5% ] 2.43% | 8,955 | 73.0% |
[ 2.5% - 3.0% ] 2.56% | 26,814 | 1.5% |
[ 2.5% - 3.0% ] 2.66% | 15,322 | 34.0% |
[ 2.5% - 3.0% ] 2.72% | 54,981 | 21.0% |
[ 2.5% - 3.0% ] 2.82% | 2,414 | 32.6% |
[ 2.5% - 3.0% ] 2.92% | 116,913 | 28.5% |
[ 3.0% - 3.5% ] 3.02% | 44,914 | 16.0% |
[ 3.0% - 3.5% ] 3.14% | 39,621 | 44.7% |
[ 3.0% - 3.5% ] 3.27% | 11,753 | 18.0% |
[ 3.0% - 3.5% ] 3.35% | 5,368 | 23.9% |
[ 3.0% - 3.5% ] 3.43% | 42,058 | 35.1% |
[ 3.5% - 4.0% ] 3.61% | 721 | 40.5% |
[ 3.5% - 4.0% ] 3.71% | 36,324 | 46.1% |
[ 3.5% - 4.0% ] 3.83% | 26,436 | 34.6% |
[ 3.5% - 4.0% ] 3.93% | 22,202 | 36.8% |
[ 3.5% - 4.0% ] 3.98% | 5,625 | 34.2% |
[ 4.0% - 4.5% ] 4.04% | 23,734 | 65.5% |
[ 4.0% - 4.5% ] 4.15% | 289 | 8.9% |
[ 4.0% - 4.5% ] 4.33% | 1,777 | 37.3% |
[ 4.5% - 5.0% ] 4.55% | 82,400 | 31.3% |
[ 4.5% - 5.0% ] 4.60% | 16,450 | 15.3% |
[ 4.5% - 5.0% ] 4.74% | 1,288 | 57.9% |
[ 4.5% - 5.0% ] 4.97% | 3,098 | 34.0% |
[ 5.0% - 5.5% ] 5.08% | 59 | 0.51% |
[ 5.0% - 5.5% ] 5.15% | 7,800 | 4.8% |
[ 5.5% - 6.0% ] 5.55% | 883 | 46.1% |
[ 6.0% - 6.5% ] 6.03% | 35,967 | 31.1% |
[ 6.0% - 6.5% ] 6.24% | 593 | 0.074% |
[ 6.5% - 7.0% ] 6.85% | 3,589 | 22.7% |
[ 7.5% - 8.0% ] 7.99% | 5,030 | 2.8% |
[ 8.0% - 8.5% ] 8.17% | 1,041 | 58.2% |
[ 9.5% - 10.0% ] 9.59% | 605 | 7.7% |
[ 10.5% - 11.0% ] 10.81% | 14,639 | 62.2% |
[ 10.5% - 11.0% ] 10.86% | 14,572 | 62.5% |
[ 17.5% - 18.0% ] 17.90% | 391 | 31.7% |