Immigrants from Argentina 1 or more Vehicles in Household
COMPARE
Immigrants from Argentina
Select to Compare
1 or more Vehicles in Household
Immigrants from Argentina 1 or more Vehicles in Household
88.9%
1+ VEHICLES AVAILABLE
9.4/ 100
METRIC RATING
216th/ 347
METRIC RANK
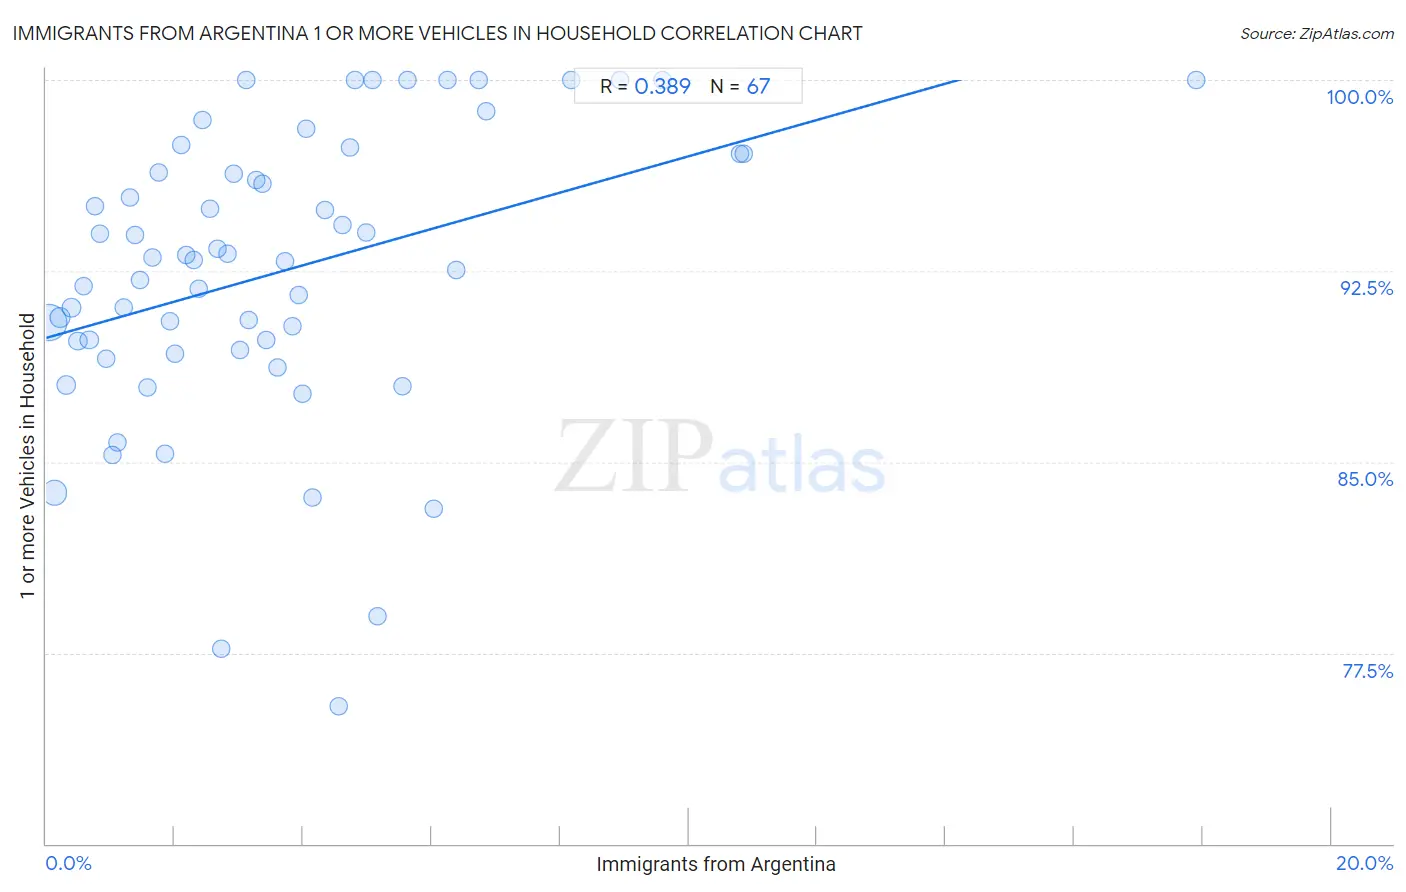
Immigrants from Argentina 1 or more Vehicles in Household Correlation Chart
The statistical analysis conducted on geographies consisting of 264,361,649 people shows a mild positive correlation between the proportion of Immigrants from Argentina and percentage of households with 1 or more vehicles available in the United States with a correlation coefficient (R) of 0.389 and weighted average of 88.9%. On average, for every 1% (one percent) increase in Immigrants from Argentina within a typical geography, there is an increase of 0.71% in percentage of households with 1 or more vehicles available.
It is essential to understand that the correlation between the percentage of Immigrants from Argentina and percentage of households with 1 or more vehicles available does not imply a direct cause-and-effect relationship. It remains uncertain whether the presence of Immigrants from Argentina influences an upward or downward trend in the level of percentage of households with 1 or more vehicles available within an area, or if Immigrants from Argentina simply ended up residing in those areas with higher or lower levels of percentage of households with 1 or more vehicles available due to other factors.
Demographics Similar to Immigrants from Argentina by 1 or more Vehicles in Household
In terms of 1 or more vehicles in household, the demographic groups most similar to Immigrants from Argentina are Immigrants from Sri Lanka (88.9%, a difference of 0.030%), Argentinean (88.9%, a difference of 0.030%), Ugandan (88.9%, a difference of 0.040%), Immigrants from Guatemala (88.9%, a difference of 0.040%), and Immigrants from Zaire (88.8%, a difference of 0.070%).
| Demographics | Rating | Rank | 1 or more Vehicles in Household |
| Immigrants from Italy | 14.0 /100 | #209 | Poor 89.1% |
| Dutch West Indians | 13.5 /100 | #210 | Poor 89.0% |
| Sierra Leoneans | 13.0 /100 | #211 | Poor 89.0% |
| Somalis | 12.8 /100 | #212 | Poor 89.0% |
| Immigrants from Western Asia | 12.3 /100 | #213 | Poor 89.0% |
| Immigrants from Hungary | 11.9 /100 | #214 | Poor 89.0% |
| Immigrants from Sri Lanka | 10.2 /100 | #215 | Poor 88.9% |
| Immigrants from Argentina | 9.4 /100 | #216 | Tragic 88.9% |
| Argentineans | 8.8 /100 | #217 | Tragic 88.9% |
| Ugandans | 8.7 /100 | #218 | Tragic 88.9% |
| Immigrants from Guatemala | 8.6 /100 | #219 | Tragic 88.9% |
| Immigrants from Zaire | 8.1 /100 | #220 | Tragic 88.8% |
| Peruvians | 7.9 /100 | #221 | Tragic 88.8% |
| Uruguayans | 7.0 /100 | #222 | Tragic 88.8% |
| Immigrants from South America | 7.0 /100 | #223 | Tragic 88.8% |
Immigrants from Argentina 1 or more Vehicles in Household Correlation Summary
| Measurement | Immigrants from Argentina Data | 1 or more Vehicles in Household Data |
| Minimum | 0.040% | 75.4% |
| Maximum | 17.9% | 100.0% |
| Range | 17.9% | 24.6% |
| Mean | 3.6% | 92.5% |
| Median | 3.0% | 92.9% |
| Interquartile 25% (IQ1) | 1.5% | 89.4% |
| Interquartile 75% (IQ3) | 4.8% | 97.1% |
| Interquartile Range (IQR) | 3.3% | 7.7% |
| Standard Deviation (Sample) | 3.1% | 5.7% |
| Standard Deviation (Population) | 3.1% | 5.6% |
Correlation Details
| Immigrants from Argentina Percentile | Sample Size | 1 or more Vehicles in Household |
[ 0.0% - 0.5% ] 0.040% | 155,525,377 | 90.5% |
[ 0.0% - 0.5% ] 0.13% | 58,176,679 | 83.8% |
[ 0.0% - 0.5% ] 0.22% | 20,379,566 | 90.7% |
[ 0.0% - 0.5% ] 0.31% | 10,357,876 | 88.0% |
[ 0.0% - 0.5% ] 0.40% | 6,778,451 | 91.1% |
[ 0.0% - 0.5% ] 0.49% | 3,384,613 | 89.8% |
[ 0.5% - 1.0% ] 0.58% | 2,094,363 | 91.9% |
[ 0.5% - 1.0% ] 0.67% | 1,571,927 | 89.8% |
[ 0.5% - 1.0% ] 0.77% | 887,513 | 95.0% |
[ 0.5% - 1.0% ] 0.84% | 681,937 | 94.0% |
[ 0.5% - 1.0% ] 0.94% | 784,100 | 89.1% |
[ 1.0% - 1.5% ] 1.03% | 361,912 | 85.3% |
[ 1.0% - 1.5% ] 1.10% | 784,575 | 85.8% |
[ 1.0% - 1.5% ] 1.21% | 471,222 | 91.1% |
[ 1.0% - 1.5% ] 1.31% | 331,633 | 95.4% |
[ 1.0% - 1.5% ] 1.38% | 58,611 | 93.9% |
[ 1.0% - 1.5% ] 1.46% | 35,321 | 92.2% |
[ 1.5% - 2.0% ] 1.57% | 237,474 | 87.9% |
[ 1.5% - 2.0% ] 1.65% | 312,525 | 93.0% |
[ 1.5% - 2.0% ] 1.75% | 22,688 | 96.3% |
[ 1.5% - 2.0% ] 1.84% | 102,836 | 85.3% |
[ 1.5% - 2.0% ] 1.93% | 80,794 | 90.5% |
[ 1.5% - 2.0% ] 2.00% | 95,762 | 89.3% |
[ 2.0% - 2.5% ] 2.10% | 28,405 | 97.5% |
[ 2.0% - 2.5% ] 2.19% | 61,301 | 93.1% |
[ 2.0% - 2.5% ] 2.29% | 42,408 | 92.9% |
[ 2.0% - 2.5% ] 2.38% | 26,372 | 91.8% |
[ 2.0% - 2.5% ] 2.44% | 9,891 | 98.4% |
[ 2.5% - 3.0% ] 2.56% | 26,814 | 94.9% |
[ 2.5% - 3.0% ] 2.66% | 15,898 | 93.4% |
[ 2.5% - 3.0% ] 2.72% | 54,981 | 77.7% |
[ 2.5% - 3.0% ] 2.82% | 2,414 | 93.2% |
[ 2.5% - 3.0% ] 2.92% | 116,913 | 96.3% |
[ 3.0% - 3.5% ] 3.02% | 44,914 | 89.4% |
[ 3.0% - 3.5% ] 3.11% | 546 | 100.0% |
[ 3.0% - 3.5% ] 3.14% | 46,704 | 90.6% |
[ 3.0% - 3.5% ] 3.27% | 11,753 | 96.1% |
[ 3.0% - 3.5% ] 3.36% | 7,435 | 95.9% |
[ 3.0% - 3.5% ] 3.43% | 42,058 | 89.8% |
[ 3.5% - 4.0% ] 3.61% | 721 | 88.7% |
[ 3.5% - 4.0% ] 3.71% | 36,324 | 92.9% |
[ 3.5% - 4.0% ] 3.83% | 26,436 | 90.3% |
[ 3.5% - 4.0% ] 3.93% | 24,256 | 91.6% |
[ 3.5% - 4.0% ] 3.98% | 5,625 | 87.7% |
[ 4.0% - 4.5% ] 4.04% | 23,734 | 98.1% |
[ 4.0% - 4.5% ] 4.15% | 289 | 83.6% |
[ 4.0% - 4.5% ] 4.33% | 1,777 | 94.9% |
[ 4.5% - 5.0% ] 4.55% | 82,400 | 75.4% |
[ 4.5% - 5.0% ] 4.60% | 16,450 | 94.3% |
[ 4.5% - 5.0% ] 4.74% | 1,288 | 97.3% |
[ 4.5% - 5.0% ] 4.80% | 271 | 100.0% |
[ 4.5% - 5.0% ] 4.97% | 3,098 | 94.0% |
[ 5.0% - 5.5% ] 5.08% | 59 | 100.0% |
[ 5.0% - 5.5% ] 5.15% | 7,800 | 78.9% |
[ 5.5% - 6.0% ] 5.55% | 883 | 88.0% |
[ 5.5% - 6.0% ] 5.63% | 231 | 100.0% |
[ 6.0% - 6.5% ] 6.03% | 35,967 | 83.2% |
[ 6.0% - 6.5% ] 6.24% | 593 | 100.0% |
[ 6.0% - 6.5% ] 6.37% | 1,381 | 92.5% |
[ 6.5% - 7.0% ] 6.73% | 208 | 100.0% |
[ 6.5% - 7.0% ] 6.85% | 3,589 | 98.8% |
[ 8.0% - 8.5% ] 8.17% | 1,041 | 100.0% |
[ 8.5% - 9.0% ] 8.93% | 459 | 100.0% |
[ 9.5% - 10.0% ] 9.59% | 605 | 100.0% |
[ 10.5% - 11.0% ] 10.81% | 14,639 | 97.1% |
[ 10.5% - 11.0% ] 10.86% | 14,572 | 97.1% |
[ 17.5% - 18.0% ] 17.90% | 391 | 100.0% |