Immigrants from Argentina Self-Care Disability
COMPARE
Immigrants from Argentina
Select to Compare
Self-Care Disability
Immigrants from Argentina Self-Care Disability
2.3%
SELF-CARE DISABILITY
99.3/ 100
METRIC RATING
66th/ 347
METRIC RANK
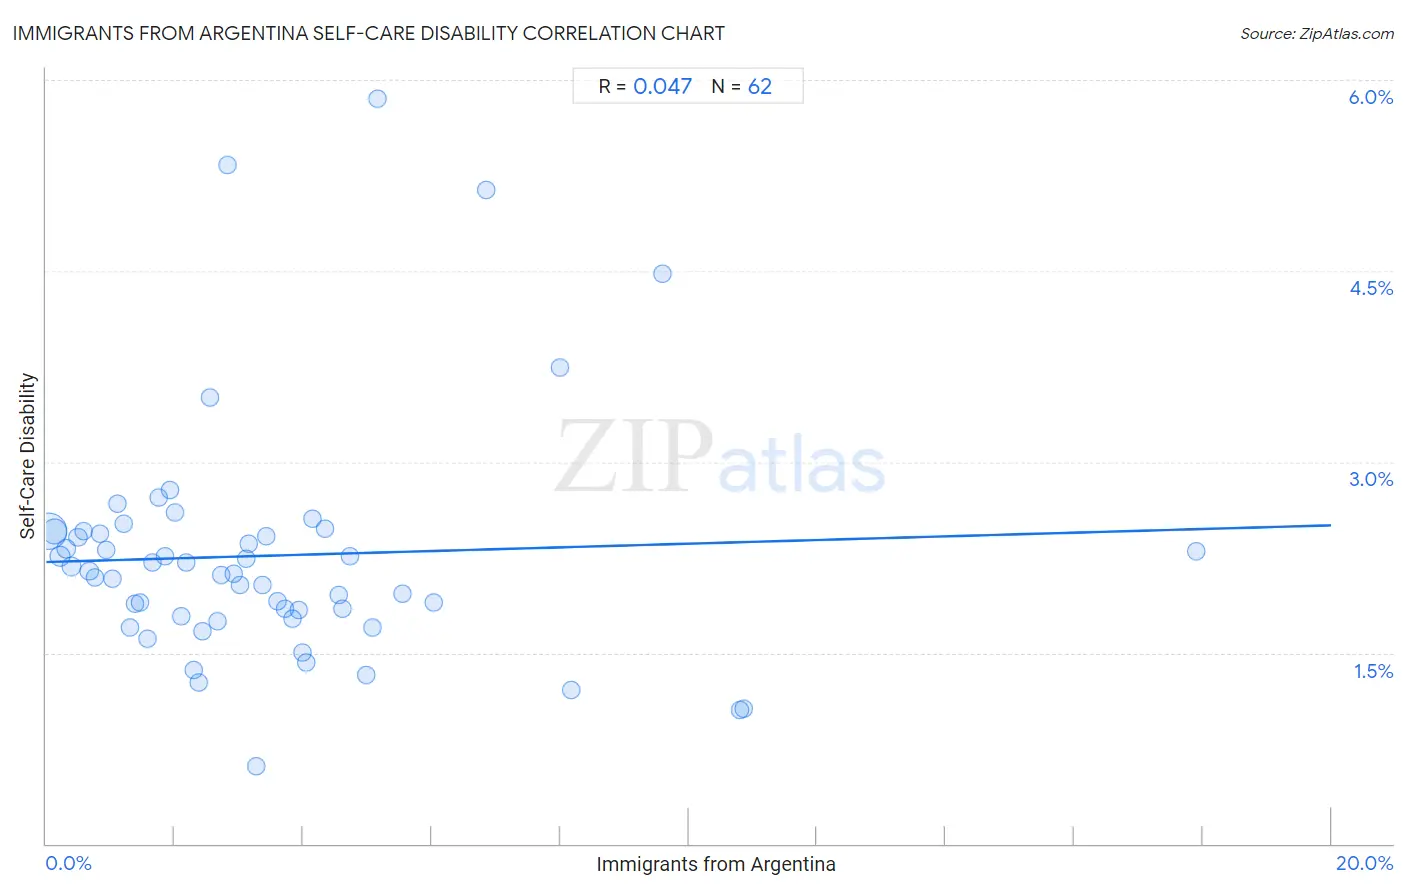
Immigrants from Argentina Self-Care Disability Correlation Chart
The statistical analysis conducted on geographies consisting of 264,279,860 people shows no correlation between the proportion of Immigrants from Argentina and percentage of population with self-care disability in the United States with a correlation coefficient (R) of 0.047 and weighted average of 2.3%. On average, for every 1% (one percent) increase in Immigrants from Argentina within a typical geography, there is an increase of 0.014% in percentage of population with self-care disability.
It is essential to understand that the correlation between the percentage of Immigrants from Argentina and percentage of population with self-care disability does not imply a direct cause-and-effect relationship. It remains uncertain whether the presence of Immigrants from Argentina influences an upward or downward trend in the level of percentage of population with self-care disability within an area, or if Immigrants from Argentina simply ended up residing in those areas with higher or lower levels of percentage of population with self-care disability due to other factors.
Demographics Similar to Immigrants from Argentina by Self-Care Disability
In terms of self-care disability, the demographic groups most similar to Immigrants from Argentina are Brazilian (2.3%, a difference of 0.030%), South African (2.3%, a difference of 0.030%), Swedish (2.3%, a difference of 0.090%), Mongolian (2.3%, a difference of 0.10%), and Immigrants from Zaire (2.3%, a difference of 0.12%).
| Demographics | Rating | Rank | Self-Care Disability |
| New Zealanders | 99.5 /100 | #59 | Exceptional 2.3% |
| Immigrants from Japan | 99.5 /100 | #60 | Exceptional 2.3% |
| Palestinians | 99.4 /100 | #61 | Exceptional 2.3% |
| Egyptians | 99.4 /100 | #62 | Exceptional 2.3% |
| Mongolians | 99.3 /100 | #63 | Exceptional 2.3% |
| Swedes | 99.3 /100 | #64 | Exceptional 2.3% |
| Brazilians | 99.3 /100 | #65 | Exceptional 2.3% |
| Immigrants from Argentina | 99.3 /100 | #66 | Exceptional 2.3% |
| South Africans | 99.3 /100 | #67 | Exceptional 2.3% |
| Immigrants from Zaire | 99.2 /100 | #68 | Exceptional 2.3% |
| Immigrants from Norway | 99.2 /100 | #69 | Exceptional 2.3% |
| Immigrants from Northern Europe | 99.2 /100 | #70 | Exceptional 2.3% |
| Asians | 99.2 /100 | #71 | Exceptional 2.3% |
| Eastern Europeans | 99.2 /100 | #72 | Exceptional 2.3% |
| Immigrants from Egypt | 99.1 /100 | #73 | Exceptional 2.3% |
Immigrants from Argentina Self-Care Disability Correlation Summary
| Measurement | Immigrants from Argentina Data | Self-Care Disability Data |
| Minimum | 0.040% | 0.61% |
| Maximum | 17.9% | 5.8% |
| Range | 17.9% | 5.2% |
| Mean | 3.4% | 2.3% |
| Median | 2.8% | 2.1% |
| Interquartile 25% (IQ1) | 1.4% | 1.8% |
| Interquartile 75% (IQ3) | 4.3% | 2.5% |
| Interquartile Range (IQR) | 3.0% | 0.66% |
| Standard Deviation (Sample) | 3.1% | 0.95% |
| Standard Deviation (Population) | 3.1% | 0.94% |
Correlation Details
| Immigrants from Argentina Percentile | Sample Size | Self-Care Disability |
[ 0.0% - 0.5% ] 0.040% | 155,525,377 | 2.5% |
[ 0.0% - 0.5% ] 0.13% | 58,164,055 | 2.5% |
[ 0.0% - 0.5% ] 0.22% | 20,375,614 | 2.3% |
[ 0.0% - 0.5% ] 0.31% | 10,356,926 | 2.3% |
[ 0.0% - 0.5% ] 0.40% | 6,769,298 | 2.2% |
[ 0.0% - 0.5% ] 0.49% | 3,383,102 | 2.4% |
[ 0.5% - 1.0% ] 0.58% | 2,093,709 | 2.5% |
[ 0.5% - 1.0% ] 0.67% | 1,559,901 | 2.1% |
[ 0.5% - 1.0% ] 0.77% | 882,935 | 2.1% |
[ 0.5% - 1.0% ] 0.84% | 680,755 | 2.4% |
[ 0.5% - 1.0% ] 0.94% | 783,216 | 2.3% |
[ 1.0% - 1.5% ] 1.03% | 360,790 | 2.1% |
[ 1.0% - 1.5% ] 1.10% | 784,575 | 2.7% |
[ 1.0% - 1.5% ] 1.21% | 471,222 | 2.5% |
[ 1.0% - 1.5% ] 1.31% | 330,946 | 1.7% |
[ 1.0% - 1.5% ] 1.37% | 47,388 | 1.9% |
[ 1.0% - 1.5% ] 1.46% | 34,773 | 1.9% |
[ 1.5% - 2.0% ] 1.57% | 237,474 | 1.6% |
[ 1.5% - 2.0% ] 1.65% | 311,268 | 2.2% |
[ 1.5% - 2.0% ] 1.76% | 19,910 | 2.7% |
[ 1.5% - 2.0% ] 1.84% | 95,276 | 2.3% |
[ 1.5% - 2.0% ] 1.93% | 80,794 | 2.8% |
[ 1.5% - 2.0% ] 2.00% | 95,177 | 2.6% |
[ 2.0% - 2.5% ] 2.10% | 28,121 | 1.8% |
[ 2.0% - 2.5% ] 2.19% | 59,436 | 2.2% |
[ 2.0% - 2.5% ] 2.29% | 42,320 | 1.4% |
[ 2.0% - 2.5% ] 2.37% | 20,260 | 1.3% |
[ 2.0% - 2.5% ] 2.44% | 9,891 | 1.7% |
[ 2.5% - 3.0% ] 2.56% | 26,814 | 3.5% |
[ 2.5% - 3.0% ] 2.66% | 15,898 | 1.7% |
[ 2.5% - 3.0% ] 2.72% | 54,981 | 2.1% |
[ 2.5% - 3.0% ] 2.82% | 2,414 | 5.3% |
[ 2.5% - 3.0% ] 2.92% | 116,225 | 2.1% |
[ 3.0% - 3.5% ] 3.02% | 44,914 | 2.0% |
[ 3.0% - 3.5% ] 3.11% | 546 | 2.2% |
[ 3.0% - 3.5% ] 3.14% | 46,704 | 2.4% |
[ 3.0% - 3.5% ] 3.27% | 11,753 | 0.61% |
[ 3.0% - 3.5% ] 3.36% | 7,435 | 2.0% |
[ 3.0% - 3.5% ] 3.43% | 42,058 | 2.4% |
[ 3.5% - 4.0% ] 3.61% | 721 | 1.9% |
[ 3.5% - 4.0% ] 3.71% | 36,324 | 1.8% |
[ 3.5% - 4.0% ] 3.83% | 26,436 | 1.8% |
[ 3.5% - 4.0% ] 3.93% | 22,202 | 1.8% |
[ 3.5% - 4.0% ] 3.98% | 5,625 | 1.5% |
[ 4.0% - 4.5% ] 4.04% | 23,734 | 1.4% |
[ 4.0% - 4.5% ] 4.15% | 289 | 2.6% |
[ 4.0% - 4.5% ] 4.33% | 1,777 | 2.5% |
[ 4.5% - 5.0% ] 4.55% | 82,400 | 2.0% |
[ 4.5% - 5.0% ] 4.60% | 16,450 | 1.8% |
[ 4.5% - 5.0% ] 4.74% | 1,288 | 2.3% |
[ 4.5% - 5.0% ] 4.97% | 3,098 | 1.3% |
[ 5.0% - 5.5% ] 5.08% | 59 | 1.7% |
[ 5.0% - 5.5% ] 5.15% | 7,800 | 5.8% |
[ 5.5% - 6.0% ] 5.55% | 883 | 2.0% |
[ 6.0% - 6.5% ] 6.03% | 35,967 | 1.9% |
[ 6.5% - 7.0% ] 6.85% | 3,589 | 5.1% |
[ 7.5% - 8.0% ] 7.99% | 5,719 | 3.7% |
[ 8.0% - 8.5% ] 8.17% | 1,041 | 1.2% |
[ 9.5% - 10.0% ] 9.59% | 605 | 4.5% |
[ 10.5% - 11.0% ] 10.81% | 14,639 | 1.1% |
[ 10.5% - 11.0% ] 10.86% | 14,572 | 1.1% |
[ 17.5% - 18.0% ] 17.90% | 391 | 2.3% |