Immigrants from Argentina Disability
COMPARE
Immigrants from Argentina
Select to Compare
Disability
Immigrants from Argentina Disability
10.6%
DISABILITY
100.0/ 100
METRIC RATING
29th/ 347
METRIC RANK
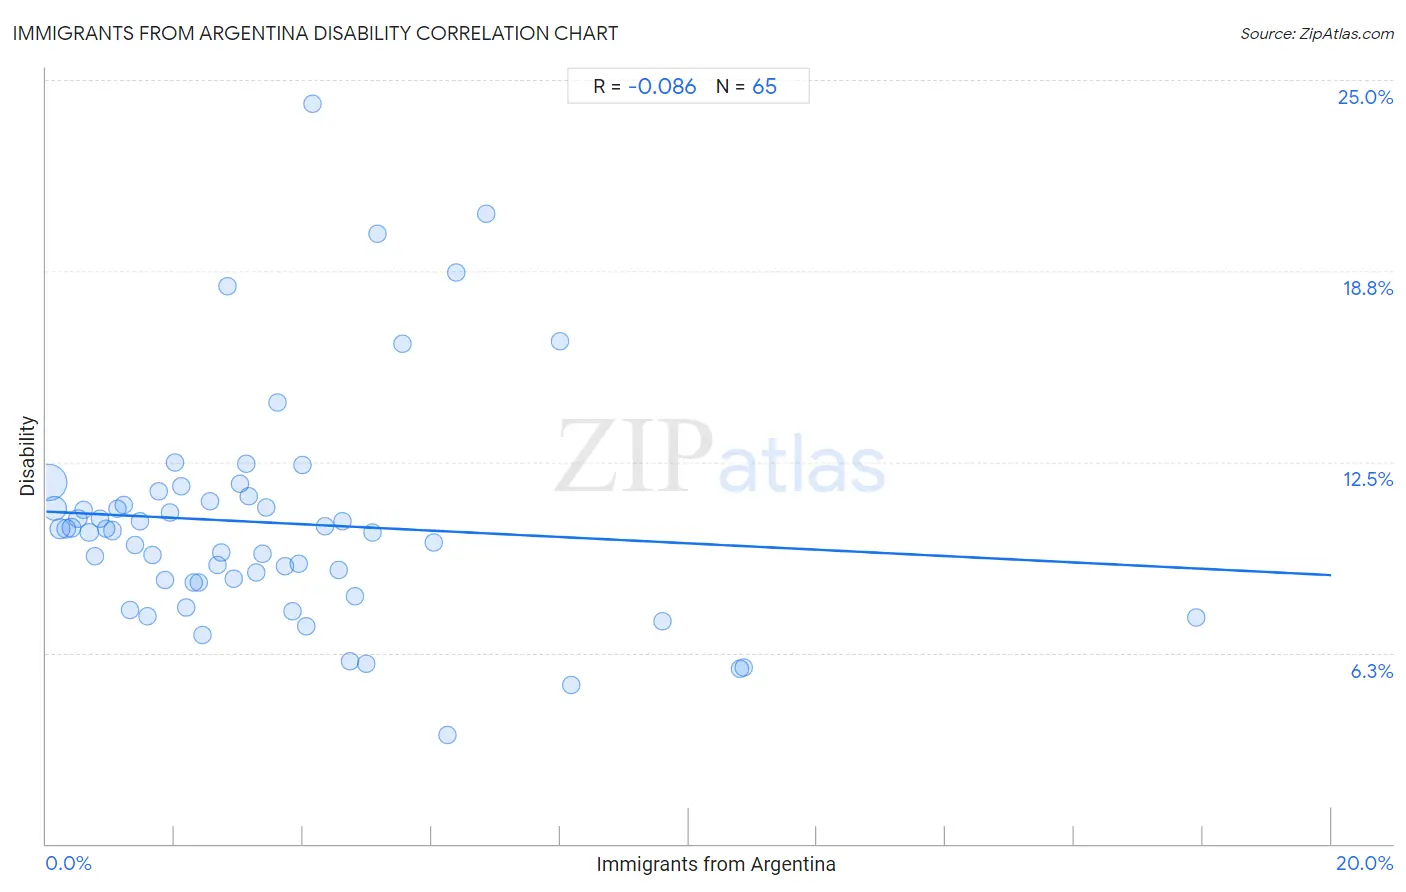
Immigrants from Argentina Disability Correlation Chart
The statistical analysis conducted on geographies consisting of 264,433,054 people shows a slight negative correlation between the proportion of Immigrants from Argentina and percentage of population with a disability in the United States with a correlation coefficient (R) of -0.086 and weighted average of 10.6%. On average, for every 1% (one percent) increase in Immigrants from Argentina within a typical geography, there is a decrease of 0.10% in percentage of population with a disability.
It is essential to understand that the correlation between the percentage of Immigrants from Argentina and percentage of population with a disability does not imply a direct cause-and-effect relationship. It remains uncertain whether the presence of Immigrants from Argentina influences an upward or downward trend in the level of percentage of population with a disability within an area, or if Immigrants from Argentina simply ended up residing in those areas with higher or lower levels of percentage of population with a disability due to other factors.
Demographics Similar to Immigrants from Argentina by Disability
In terms of disability, the demographic groups most similar to Immigrants from Argentina are Egyptian (10.6%, a difference of 0.13%), Immigrants from Turkey (10.6%, a difference of 0.15%), Immigrants from Egypt (10.6%, a difference of 0.23%), Cypriot (10.6%, a difference of 0.26%), and Argentinean (10.6%, a difference of 0.27%).
| Demographics | Rating | Rank | Disability |
| Immigrants from Sri Lanka | 100.0 /100 | #22 | Exceptional 10.5% |
| Immigrants from Asia | 100.0 /100 | #23 | Exceptional 10.5% |
| Venezuelans | 100.0 /100 | #24 | Exceptional 10.5% |
| Immigrants from Malaysia | 100.0 /100 | #25 | Exceptional 10.6% |
| Argentineans | 100.0 /100 | #26 | Exceptional 10.6% |
| Cypriots | 100.0 /100 | #27 | Exceptional 10.6% |
| Egyptians | 100.0 /100 | #28 | Exceptional 10.6% |
| Immigrants from Argentina | 100.0 /100 | #29 | Exceptional 10.6% |
| Immigrants from Turkey | 100.0 /100 | #30 | Exceptional 10.6% |
| Immigrants from Egypt | 100.0 /100 | #31 | Exceptional 10.6% |
| Paraguayans | 100.0 /100 | #32 | Exceptional 10.6% |
| Immigrants from Kuwait | 100.0 /100 | #33 | Exceptional 10.7% |
| Immigrants from Ethiopia | 100.0 /100 | #34 | Exceptional 10.7% |
| Immigrants from Indonesia | 100.0 /100 | #35 | Exceptional 10.7% |
| Ethiopians | 100.0 /100 | #36 | Exceptional 10.7% |
Immigrants from Argentina Disability Correlation Summary
| Measurement | Immigrants from Argentina Data | Disability Data |
| Minimum | 0.040% | 3.5% |
| Maximum | 17.9% | 24.2% |
| Range | 17.9% | 20.7% |
| Mean | 3.5% | 10.5% |
| Median | 2.9% | 10.3% |
| Interquartile 25% (IQ1) | 1.4% | 8.5% |
| Interquartile 75% (IQ3) | 4.7% | 11.3% |
| Interquartile Range (IQR) | 3.2% | 2.7% |
| Standard Deviation (Sample) | 3.1% | 3.7% |
| Standard Deviation (Population) | 3.1% | 3.7% |
Correlation Details
| Immigrants from Argentina Percentile | Sample Size | Disability |
[ 0.0% - 0.5% ] 0.040% | 155,525,377 | 11.8% |
[ 0.0% - 0.5% ] 0.13% | 58,212,111 | 11.0% |
[ 0.0% - 0.5% ] 0.22% | 20,395,769 | 10.3% |
[ 0.0% - 0.5% ] 0.31% | 10,369,880 | 10.3% |
[ 0.0% - 0.5% ] 0.40% | 6,778,451 | 10.3% |
[ 0.0% - 0.5% ] 0.49% | 3,386,062 | 10.7% |
[ 0.5% - 1.0% ] 0.58% | 2,094,363 | 10.9% |
[ 0.5% - 1.0% ] 0.67% | 1,577,342 | 10.2% |
[ 0.5% - 1.0% ] 0.77% | 887,513 | 9.4% |
[ 0.5% - 1.0% ] 0.84% | 681,937 | 10.7% |
[ 0.5% - 1.0% ] 0.94% | 784,100 | 10.3% |
[ 1.0% - 1.5% ] 1.03% | 361,912 | 10.3% |
[ 1.0% - 1.5% ] 1.10% | 784,575 | 10.9% |
[ 1.0% - 1.5% ] 1.21% | 471,222 | 11.1% |
[ 1.0% - 1.5% ] 1.31% | 331,633 | 7.7% |
[ 1.0% - 1.5% ] 1.38% | 58,611 | 9.8% |
[ 1.0% - 1.5% ] 1.46% | 35,321 | 10.6% |
[ 1.5% - 2.0% ] 1.57% | 237,474 | 7.5% |
[ 1.5% - 2.0% ] 1.65% | 312,525 | 9.4% |
[ 1.5% - 2.0% ] 1.75% | 22,688 | 11.5% |
[ 1.5% - 2.0% ] 1.84% | 102,836 | 8.6% |
[ 1.5% - 2.0% ] 1.93% | 80,794 | 10.8% |
[ 1.5% - 2.0% ] 2.00% | 95,762 | 12.5% |
[ 2.0% - 2.5% ] 2.10% | 28,405 | 11.7% |
[ 2.0% - 2.5% ] 2.19% | 59,436 | 7.7% |
[ 2.0% - 2.5% ] 2.29% | 42,408 | 8.5% |
[ 2.0% - 2.5% ] 2.38% | 26,372 | 8.5% |
[ 2.0% - 2.5% ] 2.44% | 9,891 | 6.8% |
[ 2.5% - 3.0% ] 2.56% | 26,814 | 11.2% |
[ 2.5% - 3.0% ] 2.66% | 15,898 | 9.1% |
[ 2.5% - 3.0% ] 2.72% | 54,981 | 9.5% |
[ 2.5% - 3.0% ] 2.82% | 2,414 | 18.3% |
[ 2.5% - 3.0% ] 2.92% | 116,913 | 8.7% |
[ 3.0% - 3.5% ] 3.02% | 44,914 | 11.8% |
[ 3.0% - 3.5% ] 3.11% | 546 | 12.5% |
[ 3.0% - 3.5% ] 3.14% | 46,704 | 11.4% |
[ 3.0% - 3.5% ] 3.27% | 11,753 | 8.9% |
[ 3.0% - 3.5% ] 3.36% | 7,435 | 9.5% |
[ 3.0% - 3.5% ] 3.43% | 42,058 | 11.0% |
[ 3.5% - 4.0% ] 3.61% | 721 | 14.4% |
[ 3.5% - 4.0% ] 3.71% | 36,324 | 9.1% |
[ 3.5% - 4.0% ] 3.83% | 26,436 | 7.6% |
[ 3.5% - 4.0% ] 3.93% | 22,202 | 9.2% |
[ 3.5% - 4.0% ] 3.98% | 5,625 | 12.4% |
[ 4.0% - 4.5% ] 4.04% | 23,734 | 7.1% |
[ 4.0% - 4.5% ] 4.15% | 289 | 24.2% |
[ 4.0% - 4.5% ] 4.33% | 1,777 | 10.4% |
[ 4.5% - 5.0% ] 4.55% | 82,400 | 9.0% |
[ 4.5% - 5.0% ] 4.60% | 16,450 | 10.5% |
[ 4.5% - 5.0% ] 4.74% | 1,288 | 6.0% |
[ 4.5% - 5.0% ] 4.80% | 271 | 8.1% |
[ 4.5% - 5.0% ] 4.97% | 3,098 | 5.9% |
[ 5.0% - 5.5% ] 5.08% | 59 | 10.2% |
[ 5.0% - 5.5% ] 5.15% | 7,800 | 20.0% |
[ 5.5% - 6.0% ] 5.55% | 883 | 16.4% |
[ 6.0% - 6.5% ] 6.03% | 35,967 | 9.9% |
[ 6.0% - 6.5% ] 6.24% | 593 | 3.5% |
[ 6.0% - 6.5% ] 6.37% | 1,381 | 18.7% |
[ 6.5% - 7.0% ] 6.85% | 3,589 | 20.6% |
[ 7.5% - 8.0% ] 7.99% | 5,719 | 16.4% |
[ 8.0% - 8.5% ] 8.17% | 1,041 | 5.2% |
[ 9.5% - 10.0% ] 9.59% | 605 | 7.3% |
[ 10.5% - 11.0% ] 10.81% | 14,639 | 5.7% |
[ 10.5% - 11.0% ] 10.86% | 14,572 | 5.8% |
[ 17.5% - 18.0% ] 17.90% | 391 | 7.4% |